
Landing Pages Long Tail Analysis Segmented by Conversion
I love looking at landing pages, especially segmenting the report by conversion. We all land on a page via search engines, external sites, email, banner ads, bookmark, Facebook, etc.
Regardless of where site traffic comes from, if the landing page is an optimal page that speaks to people’s needs, eventually, people may convert to that site.
A conversion could be anything. It could be an instant that defines the moment of success.
Here are some examples:
- Orders
- Subscribed for blog feed
- Email subscription
- Clicked on Twitter, LinkedIn, about us link
- Generated product review/testimonial
- Shared content (advocated)
- Clicked on on-site ads
- Acquired a lead
When you segment your data based on a specific conversion, you will find various segmented data sets yielding different results in KPIs.
Assessing landing pages based on conversions is great because it allows you to focus on the first page that convinced your site visitor to convert or complete their action.
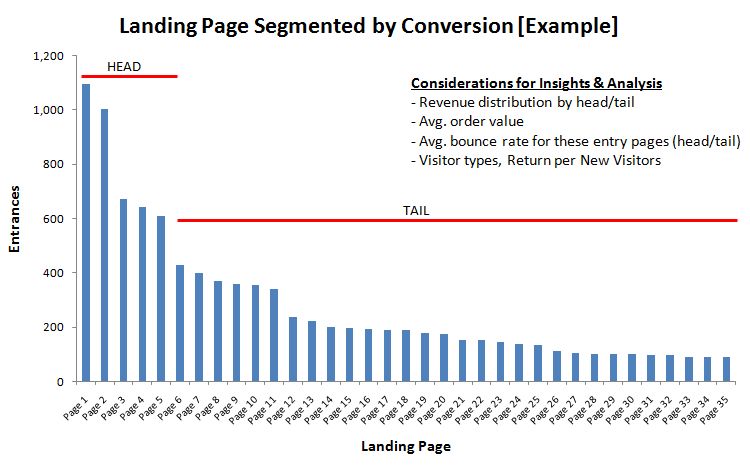
Looking at this example chart, you can see the head and the tail based on the cut-off you define. For example, the top 5 pages contributed 50% of the revenue.
Given that there is a total of 35 landing pages that contributed to conversions, it is insightful to know that these five pages helped you generate 50% of your revenue!
The biggest question is, what strategy are you going to introduce to optimize the other 30 pages? Even if you improve (theoretically) all of these 30 pages to convert better, the likely hood for you to see this curve from head to tail will always exist.
However, it is very important to continue and set goals > measure > report > analyze > optimize > set goals (repeat).
What you need to look at when you optimize the long-tail pages are:
- How much did your optimization plan and action support improving the number of orders in the tail segment and revenue growth from these long-tail landing pages?
- Engagement and visitor type difference in head vs. tail. How did your optimization impact these visitors?
- Bounce rate improvements are based on optimizing these critical pages.
You may ask, what about the pages that aren’t showing up here in the landing page’s long tail chart? If those pages are so important that you think they should contribute to your site’s success, then it is a clear indication that the page is very ineffective, and it is a call-to-action to do something about it.
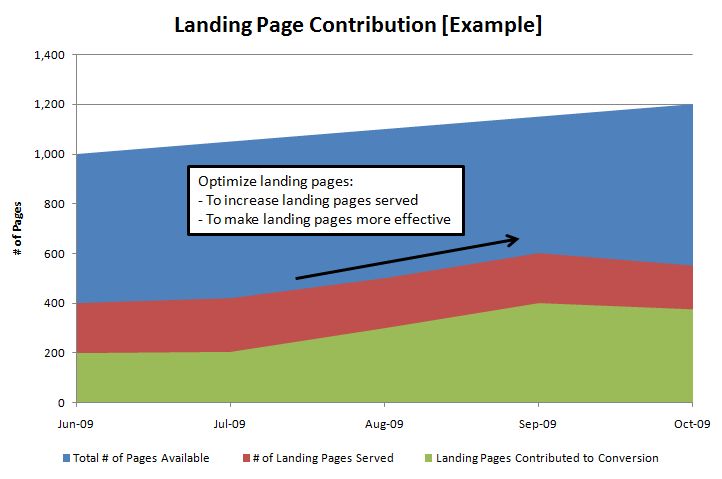
It is imperative to take this number of entry pages (segmented by orders) and divide it by an overall number of entry pages served.
For example, if you had 100 pages on your site and 90 were your entry pages, then we can say 39% (35/90) of the entry pages contribute to conversion or your desired outcome.
This is a good metric to see the allocation of effective entry pages supporting your site’s goal—a great benchmark to gauge after executing your optimization strategy.
The most important thing is to see how your campaign and optimization strategy impacted the landing pages, and I am sure you’ll see some difference in this data matrix.
Good luck analyzing your landing pages, and I’d love to hear your thoughts. If not on my blog, maybe through Twitter.
Thank you so much for taking the time to read my content. If you've liked what I've had to say please subscribe!

ZoomMetrix Newsletter
Join the newsletter to receive the latest updates in your inbox.