Benchmarking Analysis in Google Analytics
Google Analytics has introduced a benchmarking option that shows how the website’s statistics compare against other industry verticals. Currently (at the time of this writing), the available metrics you are able to compare are Visits, Pageviews, Pages per Visit, Bounce Rate, Average Time on Site, and New Visits.

I really like the device benchmark report. For those who don’t know, Google is going to prioritize Mobile website’s experience as a key signal in ranking your website’s content on Google Search.
So as you benchmark your traffic, it is definitely worth taking a close look at how you do well against other website in similar category with similar amount of traffic volume.
Be aware of measures like the Bounce Rate, Avg Session Duration and Pages/Session for mobile device. It is not the traffic volume that matters, but making sure that your mobile site is really delivering optimal experience. This report will tell you if you’re directionally doing well or not.
In 2008, the available metrics you are able to compare are Visits, Pageviews, Pages per Visit, Bounce Rate, Average Time on Site, and New Visits.
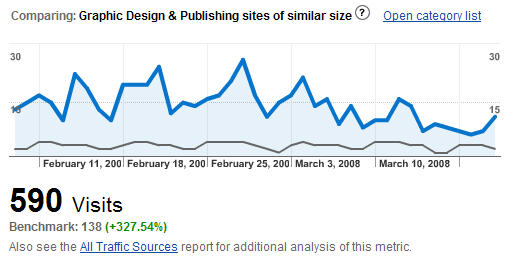
I’ve tested it against a blog site regards to “Graphic Design & Publishing” verticle. What I’ve noticed is that the Google’s benchmarking data starts to appear from February 09, 2008.
It could be a temporary thing, but based on what I observed, it is best to check when the benchmarking data appear and use that starting date as the first point of comparison.
Once, I’ve updated the date range for better comparison, following result appeared. (She has been slacking on updating her blog recently…). One thing I’ve learned is that recent optimization for SEO done on her site actually seemed to work. Maybe I should start writing about SEO…
I was surprised to see her site perform +327.5% better than other similar sized site in her vertical.

ZoomMetrix Newsletter
Join the newsletter to receive the latest updates in your inbox.