
What Is Distracting Your Customers On Your Website
This video from Google Analytics blog is a funny reminder of how many websites (including mobile site) could potentially be distracting your customers to get to what they want from your website.
I like how at the end it ends at a 404 error page. Although I haven’t experienced reaching 404 error page during my visits to a site recently, I have bumped into many cases where I’m asking myself why I have to repeat the same actions much time to accomplish one thing.
While I’m writing this, a good example I can think of is Home Page. When you imagine your house as a website, you would probably understand that you could be getting many kinds of people with different intent (i.e. mailman, neighbor, guests, friends).
Even when you host a kid’s birthday party you may get a UPS person dropping off a package. From that standpoint, do you really to have a splash page with one banner that says “LOOK AT THIS THING !!”?
Probably not. If you have guests coming in, you want then them to feel welcomed. If it is a UPS guy, you want to answer the door before he leaves and without having to deal with a barking dog.
So going back to brand’s website, when you do a research or think about your customers, think through about the audience that you could be getting.
In a personalized world, you want the page catered specific to your intent for that person for that particular moment. However, the technology is not quite there yet (I might be wrong). In that case, you want to think about a nice balance of content and size of what you’re pushing from your Home Page. Ask yourself, is this content relevant to my audience at this moment.
In analytics tools, you’ll have many data that allows you to analyze if you’re doing a good job or not. The important measure to look at is bounce rate. I’ve learned so much from analyzing bounce rate and obsessing in trying to understand why customers bounce.
VOC will be your power tool to help you understand the ‘WHY’ factor as well. I’ve used Qualaroo, iPerceptions, HotJar to push quick survey to understand what customers are thinking. That was really powerful, to understand how your site visitors feel about your site, content, or experience.
Another good measure to look for is next page path data. Some people love to use CTR (click through rate), but a lot of time that just tells you how the creative or call to action on the initial page engaged. Simply using next page path data gives you a good sense of a hint to what customers are demanding.
For example, from the Home Page, if people are visiting Support Page next, then you know you have an audience from a page who are interested to find the solution to a problem with your product or service.
Another common web analytics set up to understand customer persona and how well you’re doing to lead them to an outcome is using the Funnel report. This is pretty self-explanatory…
An advanced way to understand the pie and how well you’re doing against that is using ‘segmentation’. Many analytics tools stitch visitor’s data and allow you to collectively look at that to understand who have converted.
So segmenting on a data set that saw Home Page and visited various page types like cart, product page, or support section would be insightful.
That’ll give you a distribution of audience who touched Home Page and landed on the key pages or sections subsequently. Then you create another segmented data around people who touched Home Page and converted into various things like sales, find a retail, software download, etc.
Once you rank your distribution and compare the data side by side you’ll see some difference where your page is falling short in driving or leading customer to an outcome.
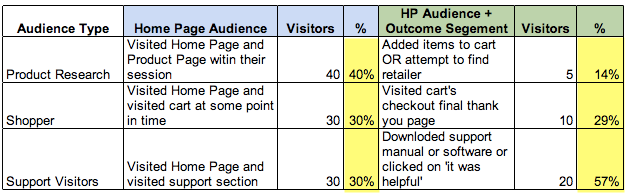
Here is an example. Note that it is not a conversion rate type of mathematics. The goal is to understand your audience and it’s outcome based on initial touch point.
When you break down the desirable outcome per Home Page visits, you’ll see that the site is doing well with Support audience, but not with Research audience.
Then you can now dig into what is failing and where you have opportunities to improve.
Some may ask, “shouldn’t you just look at conversion rate?”. Another simple example to explain this is using Amusement Park as an example.
Let’s say the park gets 100 people to the entrance, and 90 people buy the ticket to enter. That’s 90% conversion rate. That is NOT what this data is showing.
Say as a park owner, once a visitor enters the park, you want them to spend at least $50. The goal would be $50 x 100 people = $5,000.
Let’s say at the end of the day you made $3,000. That is about $30 spend per person who entered the park.
So, say you’re able to magically segment the people or data by people who spent over $50 and another segment for less than $50. Then say, data the split came out to… 50-50 (half of the people w/ over $50 in spend). You got half of the customers where your park failed to meet the goal.
Was it the service quality?
Was it the position of pretzel stands?
Was the park clean?
Was the food bad?
Now, let’s go analyze your site now, and see what is really distracting your customer experience!
Thank you so much for taking the time to read my content. If you've liked what I've had to say please subscribe!

ZoomMetrix Newsletter
Join the newsletter to receive the latest updates in your inbox.