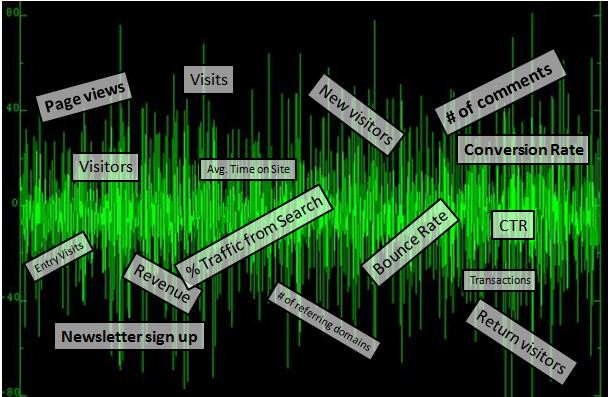
Finding Insights and Signals from Noise
I attended the eMetrics summit DC 2010 and got many new ideas. One of the things I found interesting was that data experts approach data analysis differently.
Some struggle to get to insights out of web analytics tool, and some are ahead of the curb. As Jim Stern mentioned in the opening, analysts are being challenged with finding the signal out of noise, meaning with an overwhelming amount of data being available, it becomes really difficult and challenging to find the signal or insights.
While a lot of analysts have their own method, I’d like to share what worked for me so far. Let’s break it down into different parts.

Understand the Business
I think the most important thing is understanding the business objectives and goals. Not going to get into the details on why that is important, but this is probably the most important first step. Without this, you won’t be able to set up the right Key Performance Indicators.
Set Up KPIs (Key Performance Indicators)
You may think it is easy to come up with KPIs, but it is actually very hard to solidify it. Part of the reason why it is hard is because you need to have your business, managements, clients, or internal partners to agree with it.
That whole communication process and getting people to agree on them without adding a bunch of other metrics to the list is really tough. KPIs should always be that critical few.
Working at Logitech, I’m very blessed to work with internal partners who understand that. KPIs that work for our eCommerce are Product Page Traffic, Transaction, Avg. Order Size, Revenue, and Conversion Rate.
Set up web analytics tools to measure and support that KPI visibility
When I say set up, it means:
- Tagging on the site
- Applying the custom parameters
- Creating custom reports and measures
- Setting up documents for your tagging practice to be consistent and scalable
- Set up templates in excel, API connection, data feed to data warehouse, etc
These things should revolve around the KPIs, making sure your reports are anchored to report the KPIs properly.
What about other metrics that are important?
One point that I’ll mention is optimizing your web analytics tools rigorously.
From day one, it is very difficult to have ALL of your metrics set up perfectly. That is why you should focus on the critical KPIs first.
Google Analytics has an Intelligence feature that allows you to see a significant move in data and it’ll alert you to it. At Logitech, we use Insights Rocket’s Dynamic Alert.
It allows us to see what significantly changed during a reporting period that we should pay attention to. The difference is that we use Webtrends for enterprise solution and Dynamic Alerts enables such alert features on Webtrends.
Reporting and communicating the performance of the business
Using the data that you have on KPIs, start reporting it. Make sure to have a consistent reporting cycle and practice to feedback the findings to the business. Don’t be afraid to start small and expand.
I learned from mistakes, and one of it was providing an insane amount of data in one reporting period, but that just confuses the business. Bite small and chew a lot first. See what business partners have to say about the KPIs and initial findings on your analysis.
Continuous reporting cycle allows us analyst to chew and understand the business better, and direct the analysis in the right way over time. The continuous cycle will help us analyst set a new bar to overcome and find the next story about why the KPIs moved.
Analyze and optimize your web analytics tool rigorously
Once the weekly/monthly/quarterly reports and communication processes are established, you and the business partners will have the desire to dive deeper and deeper.
That means you’ll start to analyze more dimensions and reports to understand what drove that KPIs to move.
That means you need to apply various tactics in analyzing data, and some of that methods are (not limited to):
- Segmenting the data and report
- Creating more custom reports
- Adding more measures to reports
- Joining and meshing data from different sources
- Exporting data to different tools to analyze (I recently tried Tableau and it works really great)
Feedback and check up on what’s working and not working
Acquiring feedback on both aspects for what’s working & not working, and analyst’s reports itself is really important.
Perfection will never be achieved. In other words, we’ll continue to find insights when you start taking action on the insights.
When business starts to move in the direction to onboard optimization into the business process, it’ll make the analyst’s job and analyze part really fun. However, we need to check-in and ask rather the reports were helpful or not.
In that process of analyzing and reporting, we need, to be honest about what is working and not working. That means, we need to constantly look for data that is not only giving us the increase in desirable outcomes but also point out the inefficiencies.
The journey to help business with identifying the signal out of noise is not that easy.
As you can see, there are many things you have to achieve to get to signal. The signal needs to be transmitted to the business partners and executive.
The signal needs to help business move, and move the needles of KPIs.
Thank you so much for taking the time to read my content. If you've liked what I've had to say please subscribe!
ZoomMetrix Newsletter
Join the newsletter to receive the latest updates in your inbox.