Measuring ROI Using Segmentation
Measuring ROI using ‘Segmentation’ is a common practice we do as a web analyst, and I’m sure you use it a lot when you dive deep into the data to measure the business performance.
Segmentation really makes measuring things online really fun. In this post I’d like to particularly highlight web site specific feature ROI. Assuming that common marketing campaign ROI is already being measured by many experts, I’d thought I would focus on measuring ROI of individual bits and pieces that could be unique to certain online programs.
Measuring ROI using segmentation
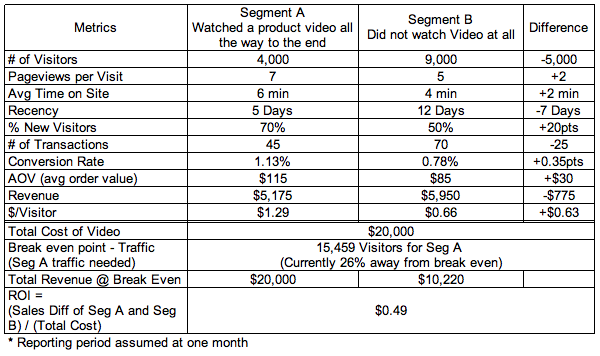
It is pretty common for businesses to invest in new features on the site to promote specific product/services, or build engagement to increase brand affinity. When the new feature is added on the web site, it is pretty common to end the analysis and reporting on its interaction or usage. If you use segmentation to do further deep dive to measure how much value it is adding, it could look like this. The scenario is based on added product video, based on an assumption that it cost $20,000 to create a very nice video.
Before touching on the ROI, it is important to look at certain measures like the volume of visitors, # of pages viewed during a visit, average time spent, etc. It gives you a sense of the high level behavioral differences between two different segments. Sometimes, the huge difference indicates something more about the segments that will give you a good sense/hint to the next analytical segments to analyze.
In this example, shorter recency may indicate that the video did a good job convincing consumers to come back soon to transact. With 70% of new and 30% return visitors transacting, consumers who transacted are likely to be made up of return visitors. Higher engagement could indicate that consumers went through the video, viewed more info, and went through the cart process. These signals are good to know before diving into actual ROI analysis, it definitely gives you additional data to tell a story.
Based on this segmentation analysis, few KPIs were reported.
- $/Visitors: Value of each visitors within each segment
- Break even point: # of traffic required for Segment A to recoup the cost of $20,000, based on the assumption that the conversion rate and $/Visitors are constant. Do the math, and it’ll also tell us % to Break Even to measure how far you are away from getting the money back from your investment. 15,459 was derived from dividing $20K by $/Visitors.
- Total Revenue @ Break Even: This is defined by the traffic required to get even with $20K spend, multiplying it with $/Visitors giving us Segment B’s Total Revenue at the same level of traffic for Segment A to break even at 15,459 visitors. We derive this to acquire a dollar value that we need to calculate ROI.
These metrics are pretty important, allowing us to understand the big picture of the video’s impact on business. Once we get the total revenue for each segments at same level of traffic, or whatever value you’d like to measure ROI against; then ROI could be measured by taking the difference and divide by the total cost. ROI yielded at a positive $0.49 return per $1 spent on video.
To me this is the fun part of being a web analyst. I’ve encountered marketers who don’t even want to talk cost because they fought so hard to get the budget just to deliver their baby (or marketing project). Then having an analyst myself asking for cost is like a big risk to them. However, we all know that won’t go well with CMO…
That’s another issue, but my point is segmentation analysis is always being discussed in many ways and hopefully I did a good job showing you how it could be used to calculate ROI. Web Analytics is not always about trending, and time series data showing spikes in traffic. Sales conversions are not the end of web analytics analysis practice.
ZoomMetrix Newsletter
Join the newsletter to receive the latest updates in your inbox.
