
Google Analytics Reporting Features You Must Take Advantage Of
Google Analytics has a variety of reports to analyze different kinds of metrics to measure your website’s performance. The great Google Analytics reporting features that are super helpful to me allow me to track exactly what is working or not in the marketing funnel.
If you don’t have a marketing funnel, you want to design one.
For the website that sells stuff
Google Analytics support e-commerce site and the reports from e-commerce is really helpful in the sense that it can tie the metrics in terms of dollar value. It provides an insight into the e-commerce activity on your website and better understands the success of your e-commerce site.
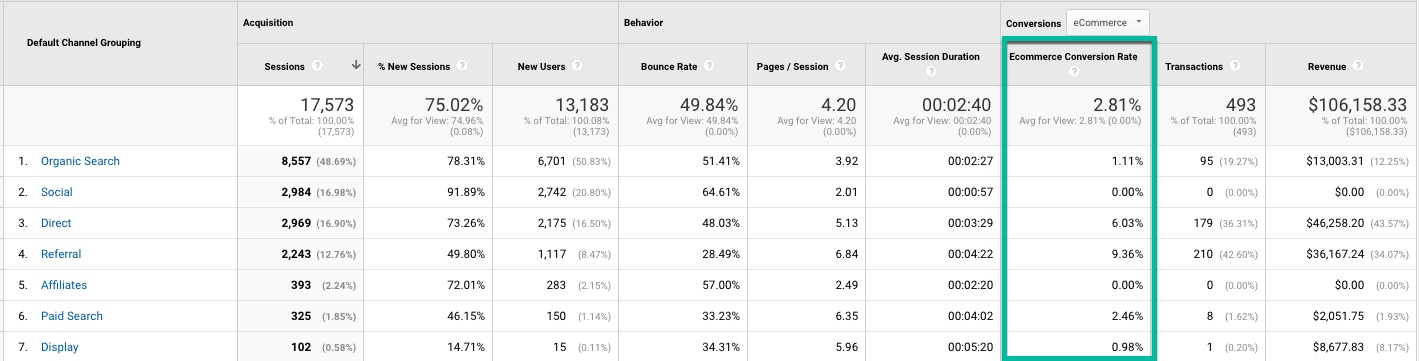
Key metrics that are important coming out of e-commerce reports are transactions, conversion rate, average order value, revenue, and traffic are some of the main reports that are necessary.
There are reports in various sections, including traffic (visitors), traffic sources, content, goal conversion, and e-commerce. Google Analytics reports could be added under these sections to your dashboard to get an overall look, in one screen, at the metrics that matter most to you.
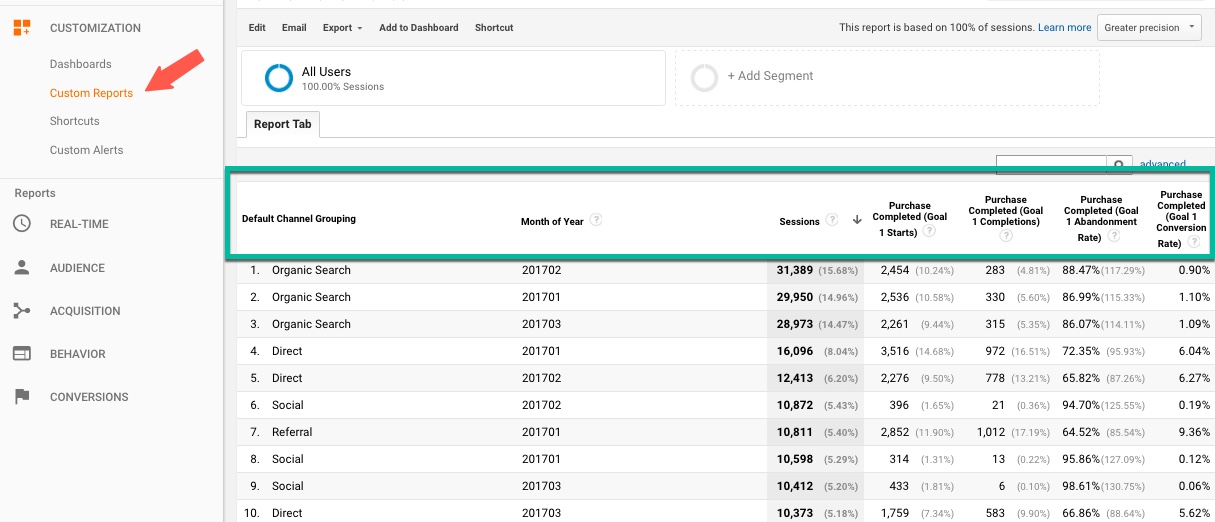
Google Analytics Custom Reports
Google Analytics has recently introduced the customs reports. They are those reports, which you create, save, and edit to give you a specific view of the data.
With the help of these, you can determine which information and metrics you want to see. Then, you can organize them in the way you want to highlight the relevant data by using the drag and drop interface.
You also have the option to create a tab if you want to see related data in another dimension of metrics. In addition, when you make the custom report, you’ll have the option of creating a drill-down or multiple levels of sub-reports by selecting the sub-dimension.
Certain Google Analytics reporting features and functions that are very useful that I recommend you to take full advantage of:
Export: Google Analytics has an export feature to download the reports in PDF, XML, CSV, and TSV. Certain reports may only allow PDF or XML.
These downloads will allow you to cater to the reports to your users in different ways.
You can pass along the PDF file without altering it, or pass XML into other reporting tools in the form of data-feed, or manipulate CSV files and enhance the reports/charts as you wish.
Time frame: Setting the time frame is one of the most important features when reporting out of Google Analytics because you were able to select your reporting period, grouping the data by day, weeks, or months.
The calendar interface makes it easy to select the day, date, or month you desire. You can also compare a date, date range to another date, or date range by choosing the "compare to past" option.
This helps you know the performance trends on your site before and after a change made on your site or landing pages.
The interface also provides you with a timeline feature, which shows you a bar graph of visits over time. In addition, a particular range can be selected, which gives you a graphic representation of the fluctuations in your report.
Email: This is a great feature for sharing your data, reports, or dashboards with certain people by email.
You can send a report instantly or schedule the report run and email it daily/weekly/monthly/quarterly basis.
If you are sending out to a group of users, you may want to consider creating a group account email address so your IT admin can control the email list when a member leaves the company or whatnot.
View/Chart options: There are several options to represent the data in various ways. Some possibilities are ordinary table view, pie chart, bar graph. Most reports contain a pie chart, basic table views, and bar graphs.
Trend graph that is in default mode in most of the reports. It gives you a snapshot view of your site's performance for various data points like conversion rate, bounce rate, visits.
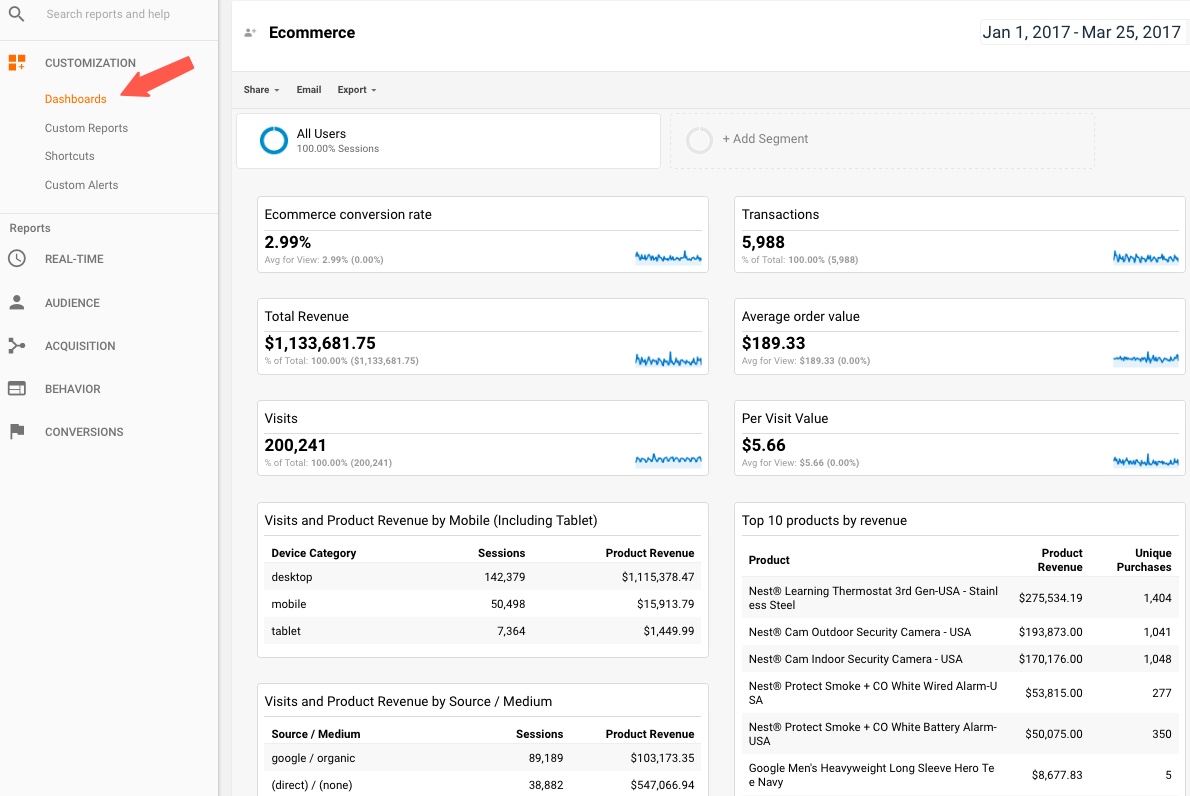
Dashboards: a dashboard is a collection of various reports. You can add a favorite report on your dashboard for a quick look into the site's performance.
It shows you a snapshot view of the customizable reports. Convenient and quick access to the entire data of your favorite reports is the greatest advantage of dashboards.
Advanced segmentation: This is my most favorite. I recommend setting up advanced segmentation and utilizing the segmentation against the custom reporting to take advantage of your useful reports with meaningful metrics.
Some advanced segmentation I’ve set up when the feature was first enabled were Engaged Audience and Not-Engaged Audience segmentations. This shows the difference in performance from those two segments against the reporting metrics you choose to run.
Engaged Audience will defer for all of you, but you can say visitors who did not bounce and spent on your site more than one minute and had 4 page views per visit.
Not-Engaged Audience could be visitors who bounced and spent less than 30 seconds (this is just an example). When you use these segmentations against your traffic sources or site sections, you’ll gain some great insights.
Google Analytics doesn’t change the reporting features often, but it is worth poking around to find your favorite report that addresses your marketing needs.
Thank you so much for taking the time to read my content. If you've liked what I've had to say please subscribe!

ZoomMetrix Newsletter
Join the newsletter to receive the latest updates in your inbox.