
Results from 4Q Iperceptions Survey | Measuring User Satisfaction
Here is an old survey I used via the 4Q Iperceptions survey that I've implemented to gain some interesting insights about my website.
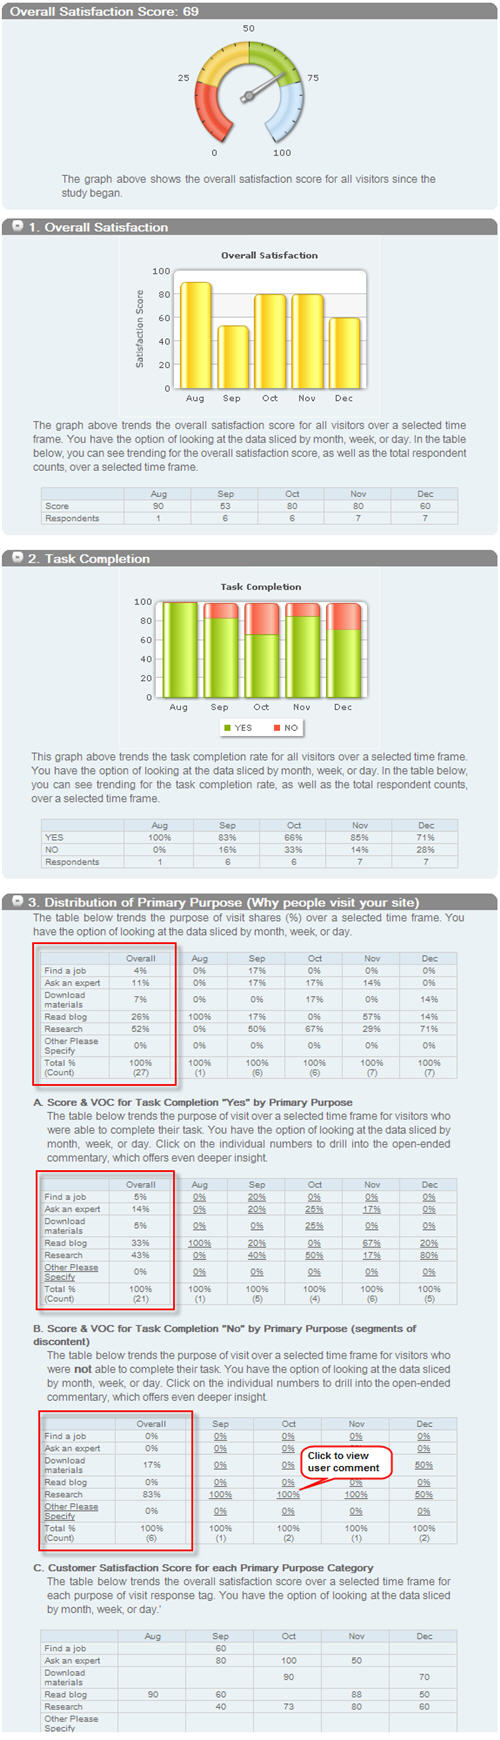
So far, 27 users have completed the survey that asked:
- How would you rate your site experience overall based on today's visit
- Which of the following best describes the primary purpose of your visit?
- Were you able to complete the purpose of your visit today?
- What do you value most about the [company] website? (asked when answered yes on Q3)
- Please tell us why you could not complete the purpose of your visit today fully? (requested when answered yes on Q3)
The results that came out of this survey were very insightful and powerful.
I was able to get better insight into the qualitative aspect of how this site is performing beyond numbers from Google Analytics.
Here is what I felt after using this wonderful tool.
1) I was glad to see the overall satisfaction score in the Green.
2) Avinash was right. Finally, there are people out there who care and are willing to give feedback.
3) User comments were a bit hard to find because you need to click on the underlined %s, but it was one of the most powerful parts of this survey, which is hearing users' raw comments. I recommend downloading the CSV file to see the comments in better view.
4) I've learned that my readers were happy with the content on my site, but it seems like a lot of them are looking for research-related content. I need to be more conscious about that aspect of needs and potentially share more data-centric research.
5) I was surprised to find quite a few users selecting "Ask an expert" for their primary purpose of visit, but I have to say my site is not doing well in providing a clear communication path to myself.
6) Although we can set the survey's invitation rate, it'll be nice to have a setting so that the study (participate in survey yes/no) would show up after a user visits the second page. But, again, this probably has to do with usability more than any other reason.
7) One thing I would recommend is to increase the time range of downloadable CSV files. For example, since we're able to select 7days to 6 months worth of data in the report, it'll be nice to have an option to download 6months worth of data in one CSV file as well.
Overall, I am very happy with this service. I think the implementation was straightforward (copy and paste the javascript code). It was very simple to get an insight into your user satisfaction score, including their comments.
I highly recommend this service to anyone running a site or blog and obtain eye-opening results.
Note: You can control the rate of invitation and handle the looks of the survey as well.
Here is the actual visual of my 4Q Iperception result:
Thank you so much for taking the time to read my content. If you've liked what I've had to say please subscribe!

ZoomMetrix Newsletter
Join the newsletter to receive the latest updates in your inbox.