
Segmentation Analysis Making Sense of Initial Event to Ultimate Outcome
I love segmentation analysis. It gives a deeper understanding of the consumer behaviors and better visibility around the marketing efforts and it’s value. It gives a better sense of what’s happening to the outcome rather than the vanity traffic metrics that many marketers love to track.
People running an online business knows many marketing efforts don’t immediately tie to sales. Marketers fuzzily know that one day those consumers who were exposed to the ad have gained brand awareness, and will one day buy your product. Let’s try to get to the specifics and avoid that fuzziness.
Many businesses in SAAS (software as a service) or social gaming companies track DAU (daily active users) and MAU (monthly active users) as KPI because an overall number of users really don’t matter when they need to grow through active users/gamers using their platform.
Taking gaming as an example, in most cases, those games are usually free, and as users get addicted to playing it, then gaming companies would do their best to drive converting those gamers to paying gamers. They pay either through monthly subscriptions, avatars, unlocking stuff, get more stages, remove ads, etc.
In such case, cohort analysis comes into the picture in their reporting and analysis practices.
A cohort study or panel study is a form of longitudinal study used commonly in medicine, social science, ecology, etc. In this case, it is an analysis of factors and follows a group of people who were exposed to a particular event and tracked across time to see how their behavior change.
A cohort is a group of people who share a common characteristic or experience within a defined period (e.g. downloaded the game for the first time, signed up for an email, create their account). Then this cohort will be followed across time to see if they perform the next desirable action.
Here is an example snapshot from KissMetrics.
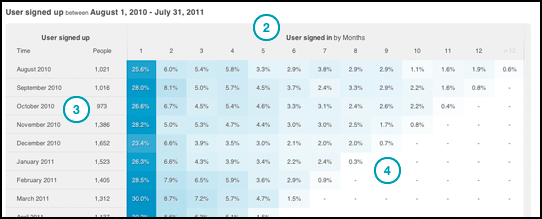
In this particular example, it is showing the number of people signed up during that reporting month. Then it follows that group of people in month 1, 2, 3, and so forth measuring “Signed In”.
So in month March 2011, there were 1,312 people who signed up for this service, and 30% of them have come back and signed in 1 month after their initial sign up.
Seems like that 30% was the all time high when compared to historical. That could indicate some correlations to some marketing activities to drive that conversion.
To me, this is a great example of how powerful metrics could be to articulate the effectiveness of marketing or any business efforts to drive the outcome. Here are two ideas I randomly came up which you could do to:
- Track the cohorts of Marketing Campaign XYZ on people who had been exposed to the ads for the first time. Follow them and see when they convert, or sign up for a newsletter, or share content. See how changing marketing tactics or optimized ads impact the recency of the outcome.
- Track the cohorts of people who have converted to sales on your site for the first time. Then follow that cohort to see if they come back to re-purchase something else of a higher priced items.
This analysis is pretty hard to do with traditional web analytics, given that to track cohorts and define a particular group of people who you explicitly know over a massive amount of data is difficult.
In other words, if people delete their cookies or you lose track of the original cohorts then data becomes pretty dirty after several months. However, if your registrations, logins, sign up events are tied to consumer info, then you should have fewer challenges in tracking them.
Perhaps you can try this with your CRM database first, and see how that come out to.
Next… what about some deep dive segmentation in web analytics…
This is not a cohort analysis, but Google Analytics advanced segments could give you a pretty good deep analysis of your converting audience.
It looks nothing like the cohorts analysis table, but that’s totally fine. You’re looking for insights and not for pretty graphs or charts.
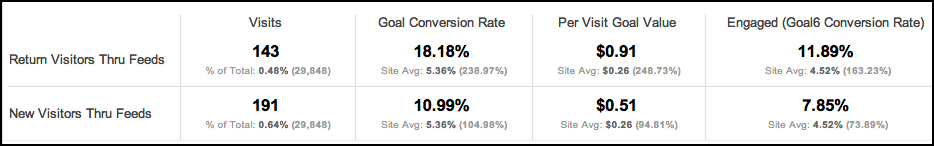
Taking a look at my own traffic for some random period. I want to compare the new visitor’s traffic who came from my feeds and see how that compares to returning visitors from the feeds.
You could compare the outcomes, and two different segments provide different results, which is great because I know now that my returning audience through feeds is super precious.
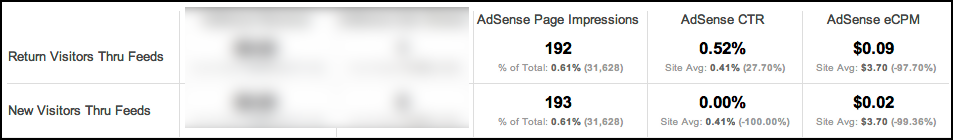
Their goal conversion rates, and AdSense response rate and eCPM are much better than my new visitors through feeds. That means I must be doing well bringing back engaged audience and they’re converting.
Now you can look at this return visitors segment’s recency report and see how recent they visit, analyze and get a good sense to see if that recency is shrinking, is it aligned to blog posts recency, etc.
To me, this is the important thing that comes out of this is the “story”.
There are many marketing tactics that drive spikes, and there are many common metrics that measure that impact for that moment. A lot of times we don’t know how to replicate that. Not so good…
These insights or analysis tactics I showed you should tell you what drives the growth of your key audience, or what marketing efforts could be replicated to bring more of this lucrative audience.
Please tell me how are you using your analytics tools to approach segmentation analysis.
Thank you so much for taking the time to read my content. If you've liked what I've had to say please subscribe!

ZoomMetrix Newsletter
Join the newsletter to receive the latest updates in your inbox.