
3 important tips to build a career in marketing analytics
What do you need to do to prepare for a career in marketing and data?
If you're interested in a career in marketing analytics, you'll need to be comfortable with numbers and data. You'll also need to have strong analytical skills and the ability to compile and interpret data. In this post, we'll give you three tips on preparing for a career in marketing analytics.
Data skills are in high demand, and one way to grow into a marketing role is by starting as the Data or Technical Director. You'll have an opportunity for continued growth within Analytics with this career path and have options of shifting over time if you want more variety!
Tip #1: Understand your audience and their marketing problems.
CMO's top priority is to drive business outcomes, like increased revenue, sales, profit, etc. 2nd priority is shaping marketing communication outcomes.
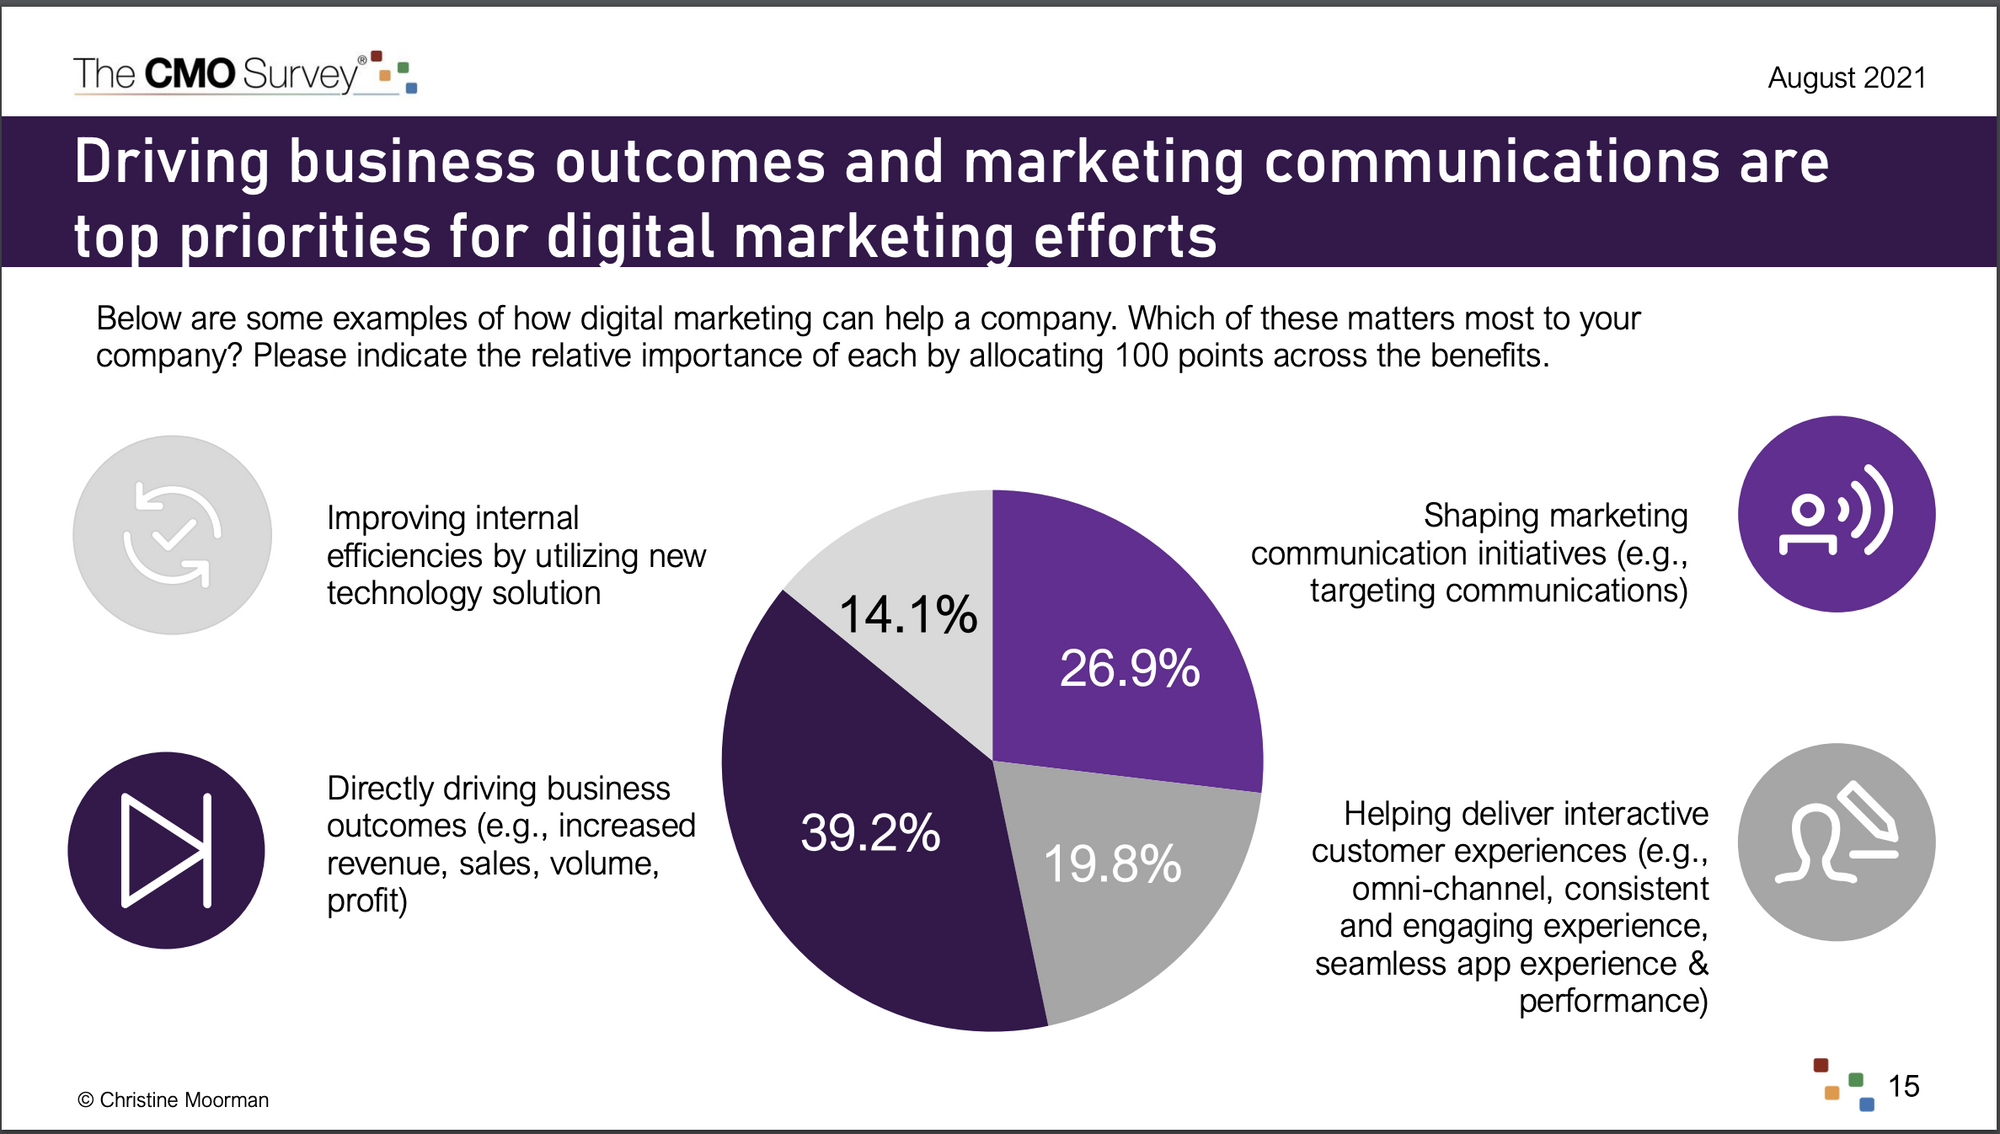
Ensure analytics is being used for a business purpose and know how it contributes to solving a problem. For example, if a company has no clear marketing goals, work with key stakeholders across departments to identify them - this will help you determine what data matters the most.
Analytics role supports someone, understand who that is and what business question they are trying to solve. So help answer those business questions tied to those priorities.
Tip #2: Learn how to prepare data or wrangle with data
Data scientists or analysts spend 45% of their time getting data ready before using it to develop models and visualizations.
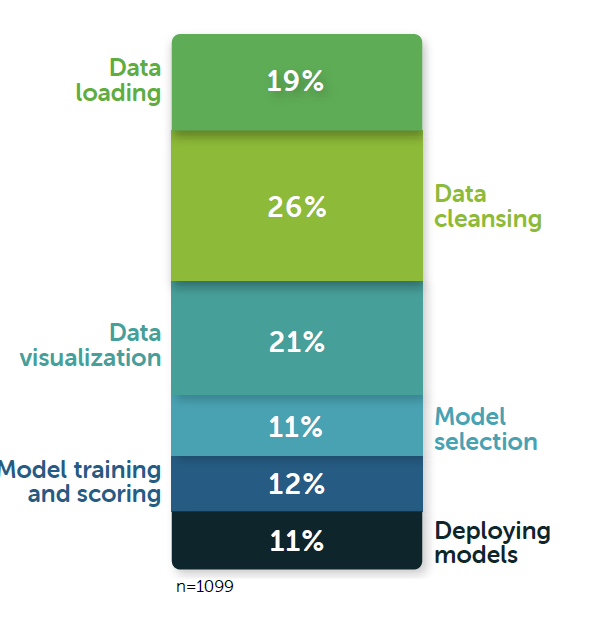
Learn to get data ready for analysis. It is the most important skill you can have in analytics.
What gets measured gets managed. If you don't track it, you don't have data, so learn how to track your data and get it ready for analysis.
I am a frequent user of Tableau, and it has many different ways to connect to the data you want to analyze. Some of the typical options you will have, and use is:
Flat file (Excel or CSV file)
A good example of how an analyst will prepare data will be exporting data from the marketing platform and cleaning the data file. That includes creating a proper header, formatting data, removing special characters, joining data to make one file with more data, etc.
Database
Another option is to connect BI tools like Tableau directly to a database like MySQL, Google BigQuery, Redshift, etc. The majority of the data preparation will take place on the database side.
A typical workflow is working with or as a data engineer; you'd prepare your data tables or views where you have a query that enables data with rows and columns of data you'd need for analysis.
Tip #3: Improve your presentation skills, and make sure to learn how to tell a story through data
Data storytelling is an extremely powerful tool for engaging stakeholders and inspiring action. However, if done incorrectly, there could be incomplete or misleading information that results in the wrong decisions being made for an organization.
When you are creating data stories and visualizing your data, don't:
- Pick arbitrary values to base your scale and units on. Make sure you are representing the full context visually.
- Only show the data that best supports your ideas. Show the whole picture.
- Be inconsistent between visuals. Use the same colors, labels, and conventions between visuals to make it easy for your audience to follow the story and understand the data accurately.
Making sure you are telling a good story is important. Use good data from reliable sources to help you understand what is happening and draw the right conclusions. Always provide context for your readers.
Data-driven storytelling can be a powerful way to help leaders understand complex ideas and make better decisions. By combining the best data visualization, data analysis, and storytelling, you can create engaging data stories that drive change.
The following visual was helpful for me to understand the focus area when it comes to storytelling with data.
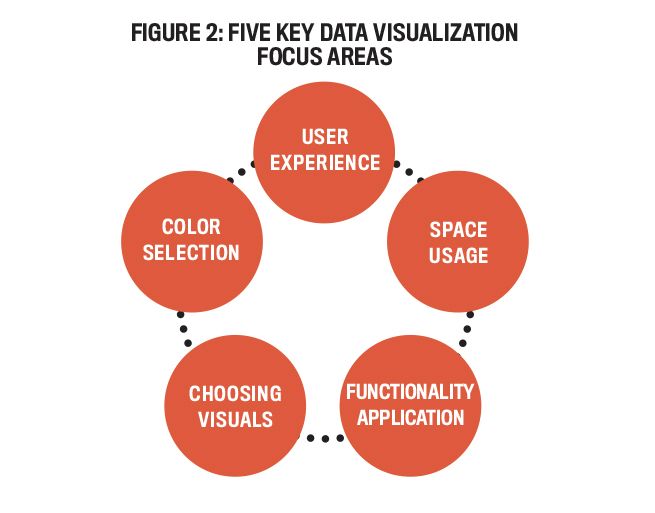
Key points from these focus areas are:
- When you are visualizing data, your picture must be easy to understand. The key points should stand out from the data, and you should be able to see your findings easily.
- Make sure that your title, company logo, and blank space are all well-placed and carefully chosen. Good spacing will subconsciously suggest that you have put thought into the visualizations and make it easier for your audience to focus on the most important insights. Blank space will also help keep the dashboard from feeling overcrowded and distracting.
- You want your dashboard to be easy to understand. The more complex the graphs and functionality, the greater the risk of losing your audience. Hard to understand dashboard means people will not get useful information from your dashboard.
- We all know that graphs and visuals can make a huge impact on our engagement with data. The simpler the graph or chart is, the more likely it will hold someone's attention for a longer time.
- The colors you choose should draw your audience's attention, and they need to have enough contrast in shades for it to be noticeable when compared with other elements on screen like text or images (or even backgrounds).
Key Takeaway
I've had the privilege to work with very talented marketing leaders, and I have learned a lot from them.
These three tips are the top tips, all tied to my personal experience from making many mistakes and overcoming many technical challenges. Throughout my career in marketing analytics, the leadership that guided me has certainly played a key role in why I chose these three tips.
I've never expected to encounter these tips in the earlier days of my career. Back then, most marketing analytics roles were referred to as web analytics. The demand for the role was dictated by what you know or have experience working with certain tools. For example, do you know how to use the Analytics tool XYZ, CRM, and Google Ads?
The marketing analytics role continues to serve and help answer business questions through data. Still, the requirements to find and hire a good marketing analytics person have changed a lot over the years.
In my view, these three tips are certainly the key things that have not changed over time. I'm sure there are more, but I'll leave you with these three for now.
If you like this article, you may also find this interesting:
 Kris
Kris

ZoomMetrix Newsletter
Join the newsletter to receive the latest updates in your inbox.