
How to Identify Geo Markets to Test and Reach Your Audience
Common measures used to identify geo markets or DMA (designated market area) for advertising and understand where a business should allocate the budget to reach the target audience are BDI and CDI.
BDI (Brand Development Index): Percentage of a brand’s sales in an area in relation to the population in that area as compared to the sales throughout the entire United States in relation to the total U.S. Population.
CDI (Category Development Index): Measures the sales strength of a particular category of product, within a specific market.
The CDI is useful in all marketing strategies when used with the Brand Development Index or BDI.
The CDI can give vital data for marketers to allocate advertising to specific areas maximizing product category knowledge and profit.
These indexes may not be familiar with folks in the digital-only world, but I believe these are pretty interesting measures digital experts should take into consideration.
Given that more people are going online and exploring online before making purchasing decision online or offline, digital analytics data is an important part of that data mix, and would certainly support gaining knowledge around market opportunities.
At the same time, as online and offline channels mix and consumer experience become more complex, it is important to start thinking about a wider mix of analytics related metrics.
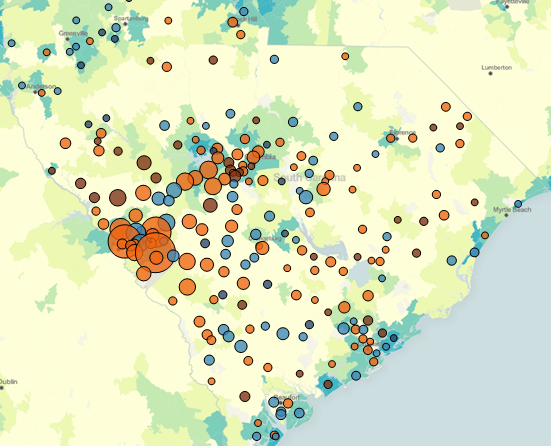
In one of the projects I was involved, I used a particular site’s geo data and broke it out by cities. Then for the top X cities, I’ve applied the population data to create an index, to see what percentage of the brand site’s traffic in a given area has a high penetration rate.
Since the traffic may contain data irrelevant for the index (depending on the objective), such as customer support data or people who bounced, etc. So choosing the right data and creating the right segmentation for the index is an important part of the analyst’s job.
Some of the things you need to check on the tools you got are:
- When you export, does it have all the data you need to slice and dice in the way you need to identify or map out?
- Some mapping tool allows zip code or latitude and longitude to plot data, but what does it take to plot the data you need?
- Mapping data. Do you have the mapping data to convert from (example..) zip code to latitude & longitude? Certain tools may not have all features to plot the data in same fashion globally. So you may need to think about acquiring mapping data for Cities to DMA or additional data point like population size to DMA.
Be aware of what data you have, and make sure you work within what you can get, and don’t let that spoil the data practice. You definitely don’t want to get too caught up on data tinkering.
The tool I use in the past is Webtrends Visitor Data Mart (VDM), and VDM has DMA/zip code/cities/states data that could be exported with other metrics that matter to the business. So for me, I’ve got the option to put together cities population size and traffic to create an index to compare against BDI or CDI data.
Using Tableau, plotting the data on a map would be easy. Having a map showing traffic or bottom line impact on Test Market vs. Non-Test Market would create a visually that tells the story on the marketing effort to the key stakeholders.
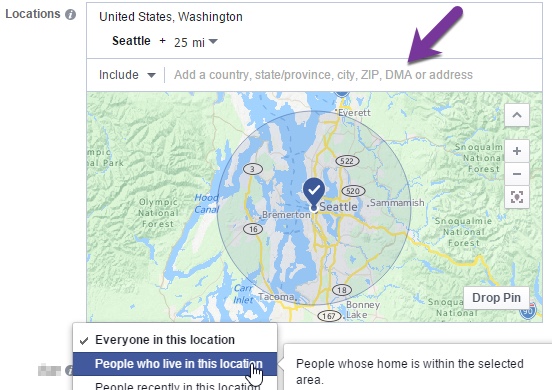
Another recent way I have tried is using Facebook Ads to target ads to particular DMA, and track those traffic and test to see if you’re able to reach your target audience. That way you can identify the geo markets that resonate with your brand.
Thank you so much for taking the time to read my content. If you've liked what I've had to say please subscribe!

ZoomMetrix Newsletter
Join the newsletter to receive the latest updates in your inbox.