
Analyze Usability to Improve User Experience and Conversions
Using digital analytics to analyze the usability of a website to improve the customer experience online and increase conversions is something I’ve been really passionate about.
We now live in a time where many CMS tools are very robust and every possible theme or site templates are available, so any people can launch a very professional looking site in minutes.
That said, testing and optimizing user experience (UX) is something many marketers are performing to improve their website’s performance.
The field of User Experience (UX) is a very interesting field incorporating various aspects of studies including psychology, anthropology, sociology, computer science, graphic design, industrial design, cognitive science, etc.
It is far more deep and complicated than my brief description, but here is the typical area of focus and outputs from UX practices (via Wikipedia).
- Site Audit
- Flows and Navigation Maps
- User stories or Scenarios
- Persona
- Site Maps and Content Inventory
- Wireframes
- Prototypes
- Written specifications
- Graphic mockups
Some of these outputs seem overlapping with IA (Information Architect) role, but these are pretty important practice in the digital world.
I want to talk about how analytics and some of the measurement tools could help website designer and UX experts make better decisions around improving the consumer experience.
First thing, you need to ask what are you trying to achieve before analyzing any data. Typical one and probably the biggest one is:
Removing the barrier users are facing so they can complete their task
In my opinion, it is all about the end users experience and what they want to achieve.
You can use the marketing technology tools in many ways want to better understand user behavior, but at some point, you need to take action against those findings, too.
There are four types of tools that I’ve used that are particularly useful for measuring, and gain actionable insights to help UX experts solve their problem.
- Web Analytics tools (e.g. Adobe SiteCatalyst, Webtrends Analytics, Google Analytics, MixPanel)
- Heatmap or interaction tracker (CrazyEgg, ClickTale, Mouse Flow, Hotjar, etc.)
- A/B testing tool (Optimizely, VWO)
- Qualitative measurement tool or survey tools (Foresee, iPerceptions, Qualaroo, Hotjar, WooHoo, Typeform)
Here is an example flow of the usage of these tools. Just as an example…
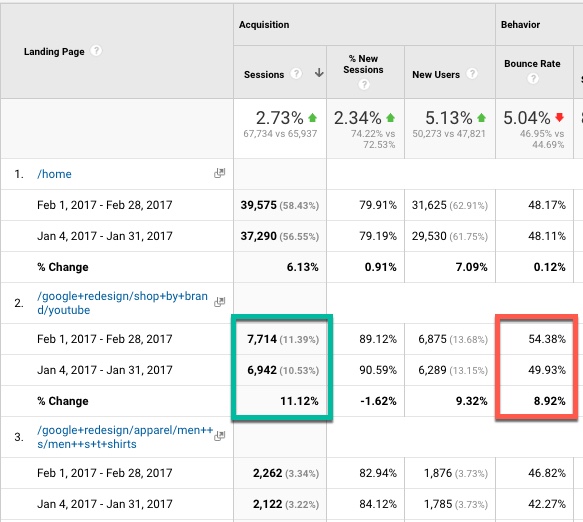
1. Web Analytics Tool
Web Analytics tool shows very high and increasing bounce rate on a particular page that is getting tons of traffic
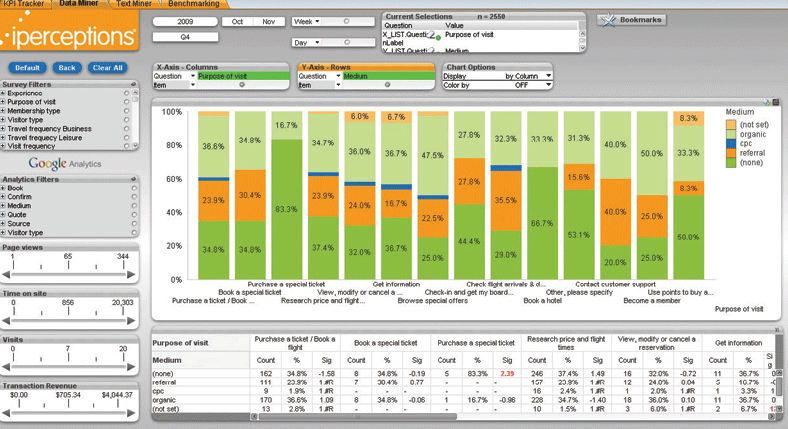
2. Customer satisfaction tool
Customer satisfaction tool tells the analyst something about the site that a particular segment of page category with very bad satisfaction score. Diving into a tool like iPerception informs the analyst that the website visitors can’t find something that they expected to find.
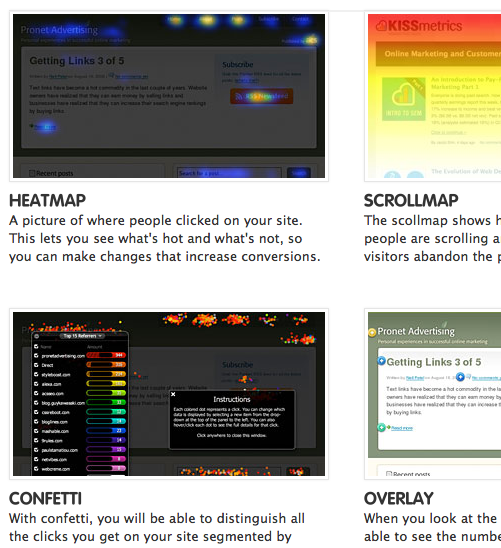
3. Heatmap tool
The Heatmap tool looks at ever aspect of the user engagement from mouse over, clicks, browser scrolls, and recordings on particular segments that engage with that page. Hypotheses are created out of this analytical practice.
4. A/B testing
A/B test is performed on that page with better navigation, call to action that speaks to the majority of the page visitors.
After the A/B test was performed, marketers rolled out the new creative and reduced the bounce rate, and task completion rate increased by X. Satisfaction score went up, and everyone involved is heroes.
Satisfaction score went up, and everyone involved is heroes. Yay!
It may sound like an expensive practice, but a lot of these technologies could be implemented at a very affordable cost.
- Google Analytics is free
- CrazyEgg has a basic plan from $9/month
- Optimizely has a free trial and has a pretty affordable plan for low traffic site
- Hotjar is very affordable and you can get started for free
The biggest challenge is the process and the resources in place that enables such execution in a rapid fashion.
In a lot of cases, it takes years for companies to even get to this level of data practice. My hope is that many companies are able to take it step by step to the next level and start demonstrating the ROI of each discipline in digital marketing analytics and testing/optimization.
If you’re struggling to prove the case that you need these tools, I’ve heard great stories from some folks where they were able to evangelize the data practices by doing many rounds of POC (proof of concepts) using various applications.
Then they’d take that results, usually, an outcome demonstrating a lift to sales would be great. Then showing the effort relative to the lift in the bottom line to the management.
People get excited when they’re involved in that journey and that is the fun part of analytics, and managers should be excited about this as well.
If you get a chance, share me your optimization stories! Would love to hear from you.
Thank you so much for taking the time to read my content. If you've liked what I've had to say please subscribe!

ZoomMetrix Newsletter
Join the newsletter to receive the latest updates in your inbox.