
Power BI market share - BI jobs demand grows as it dominates the market
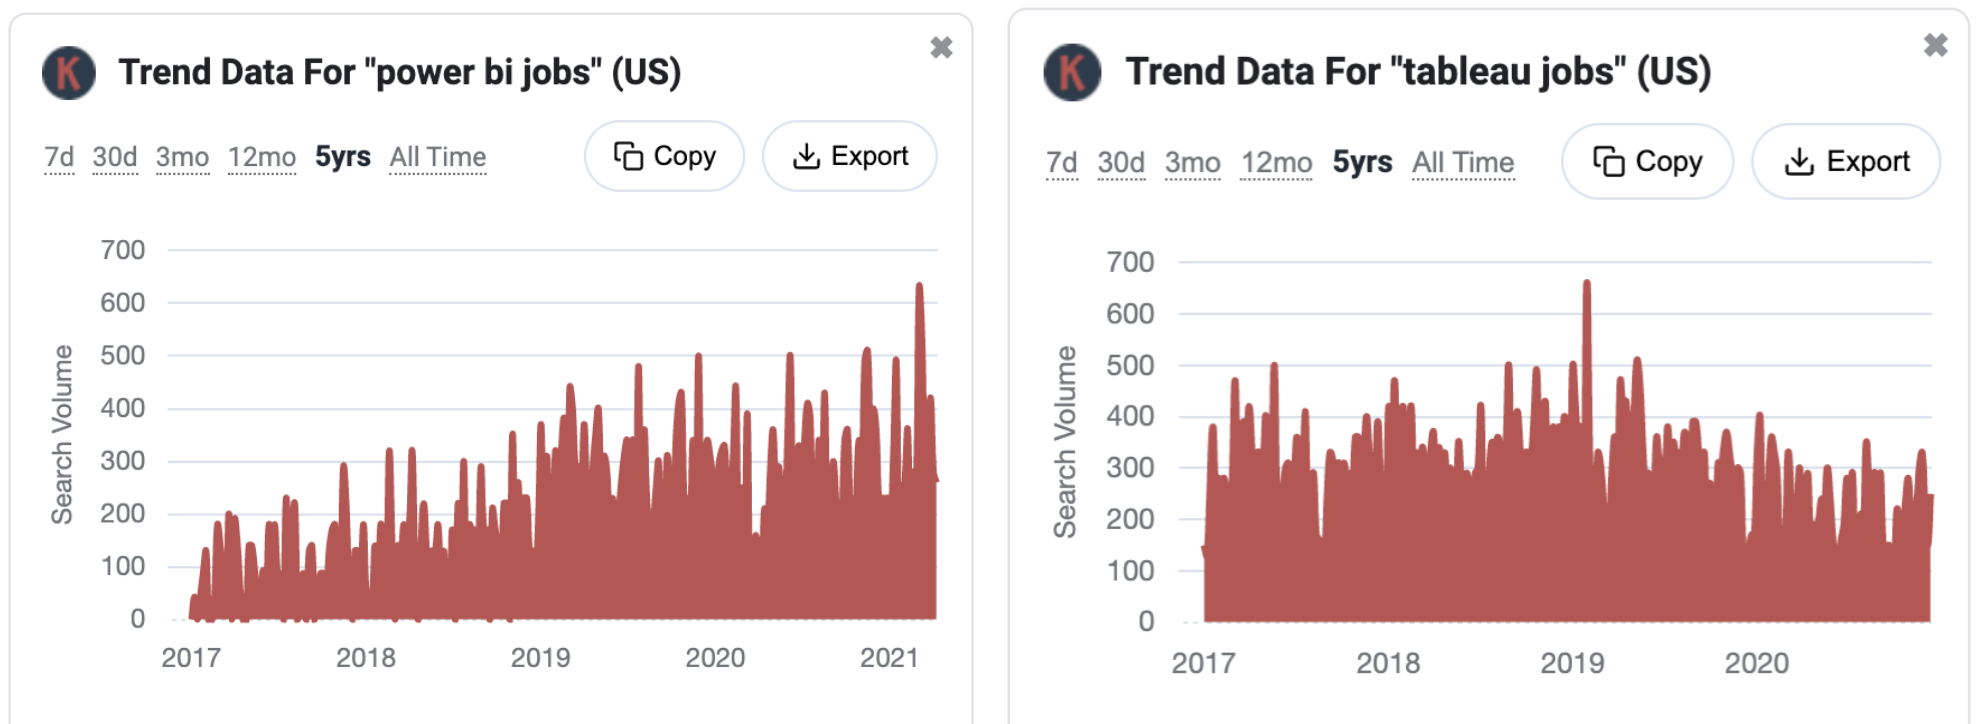
Looking at market share and search volume data, it would seem that the answer to that question is Power BI. Power BI's market share is rapidly growing while Tableau is declining. And as we know, demand for Power BI jobs is growing faster than for Tableau jobs.
I wouldn't be surprised if many marketers and analysts like you wonder if you should invest your time and money in Power BI or Tableau.
So, which tool should you invest in?
Let's first look into these data so you can make that decision.
Gartner's Magic Quadrant for Analytics & Business Intelligence
The Gartner's Magic Quadrant data in Feb 2021 showed Microsoft (Power BI) being the leader.
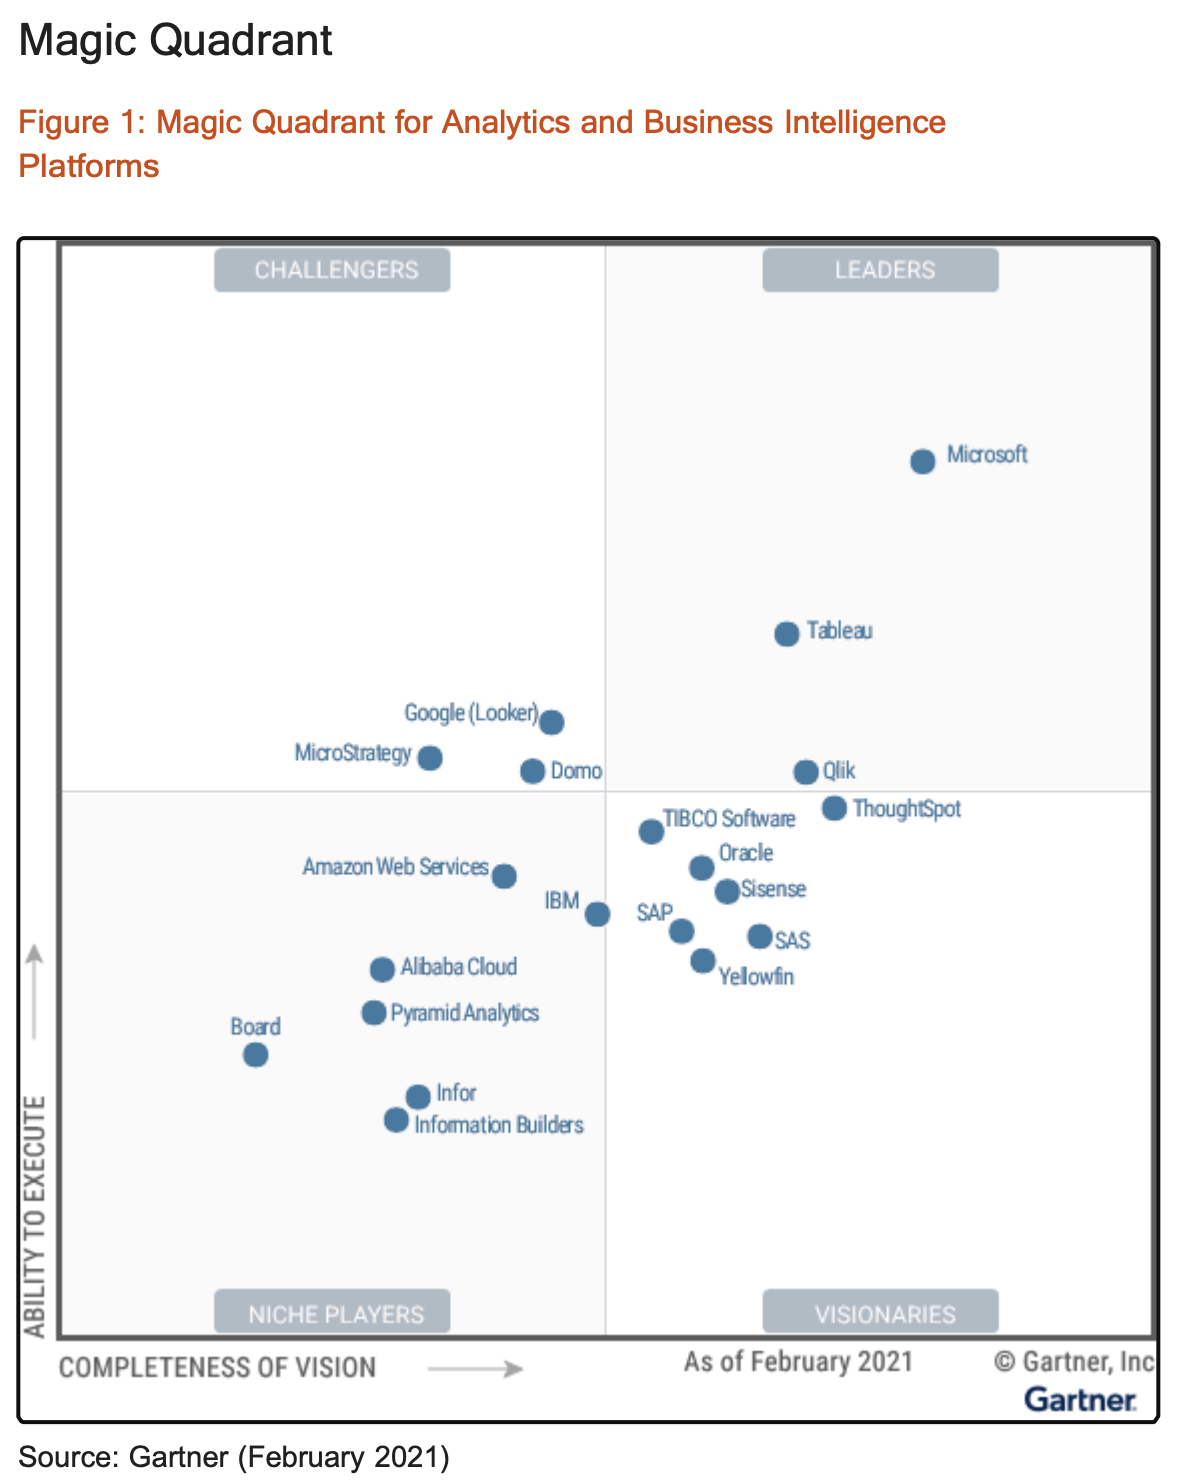
This indicates that Microsoft Power BI has achieved the fastest growth, increasing functionality and customer base. In addition, it now offers a comprehensive platform for business intelligence and analytics, with many capabilities.
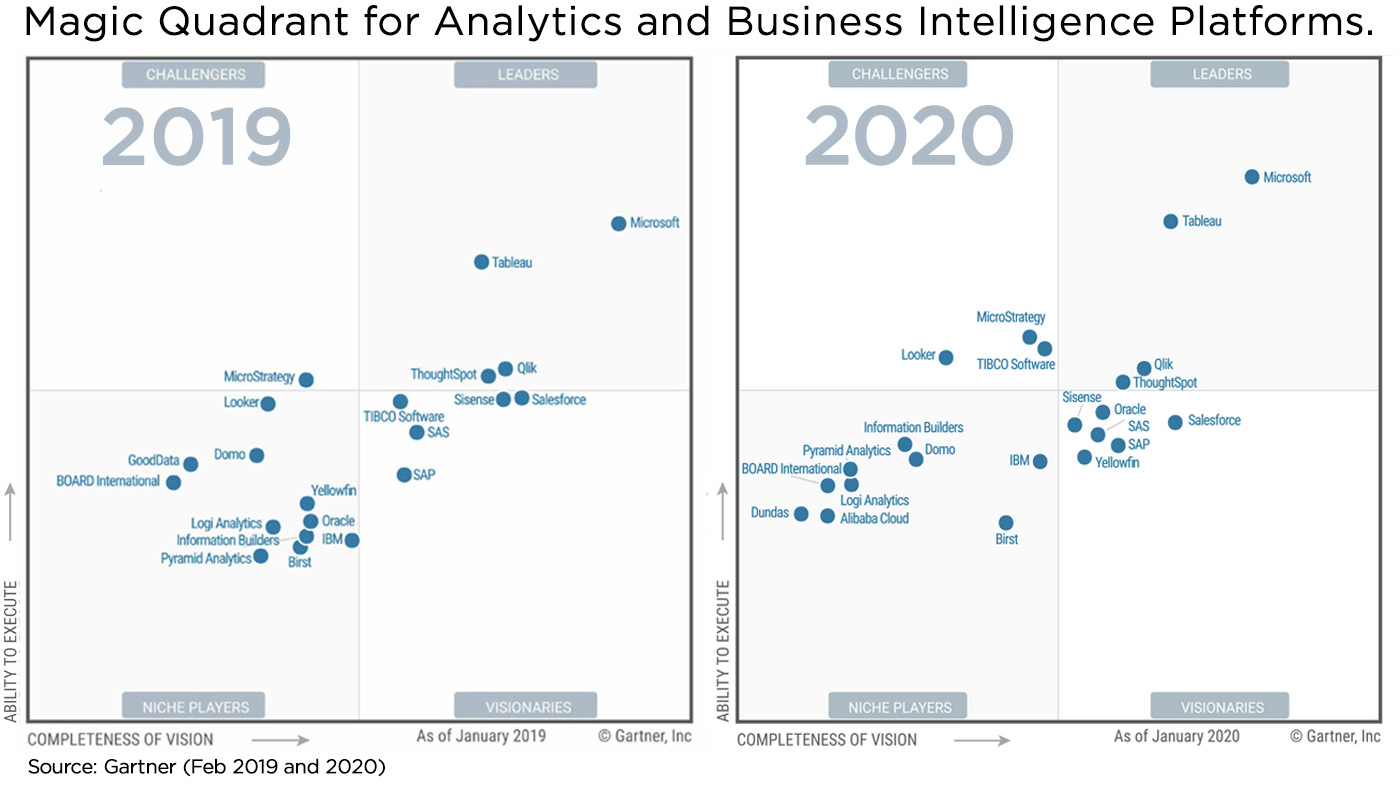
Comparing the Magic Quadrant to 2019 and 2020, it seems Power BI has been inching up on the "ability to execute" while Tableau has declined. Maybe something about the support and frequency of product updates has to do something here.
Market share of Top Business Intelligence Software in 2021
With a 36% market share, Power BI is the most popular data analytics platform among businesses. Power BI's market share being 1.8x higher than Tableau is pretty significant.
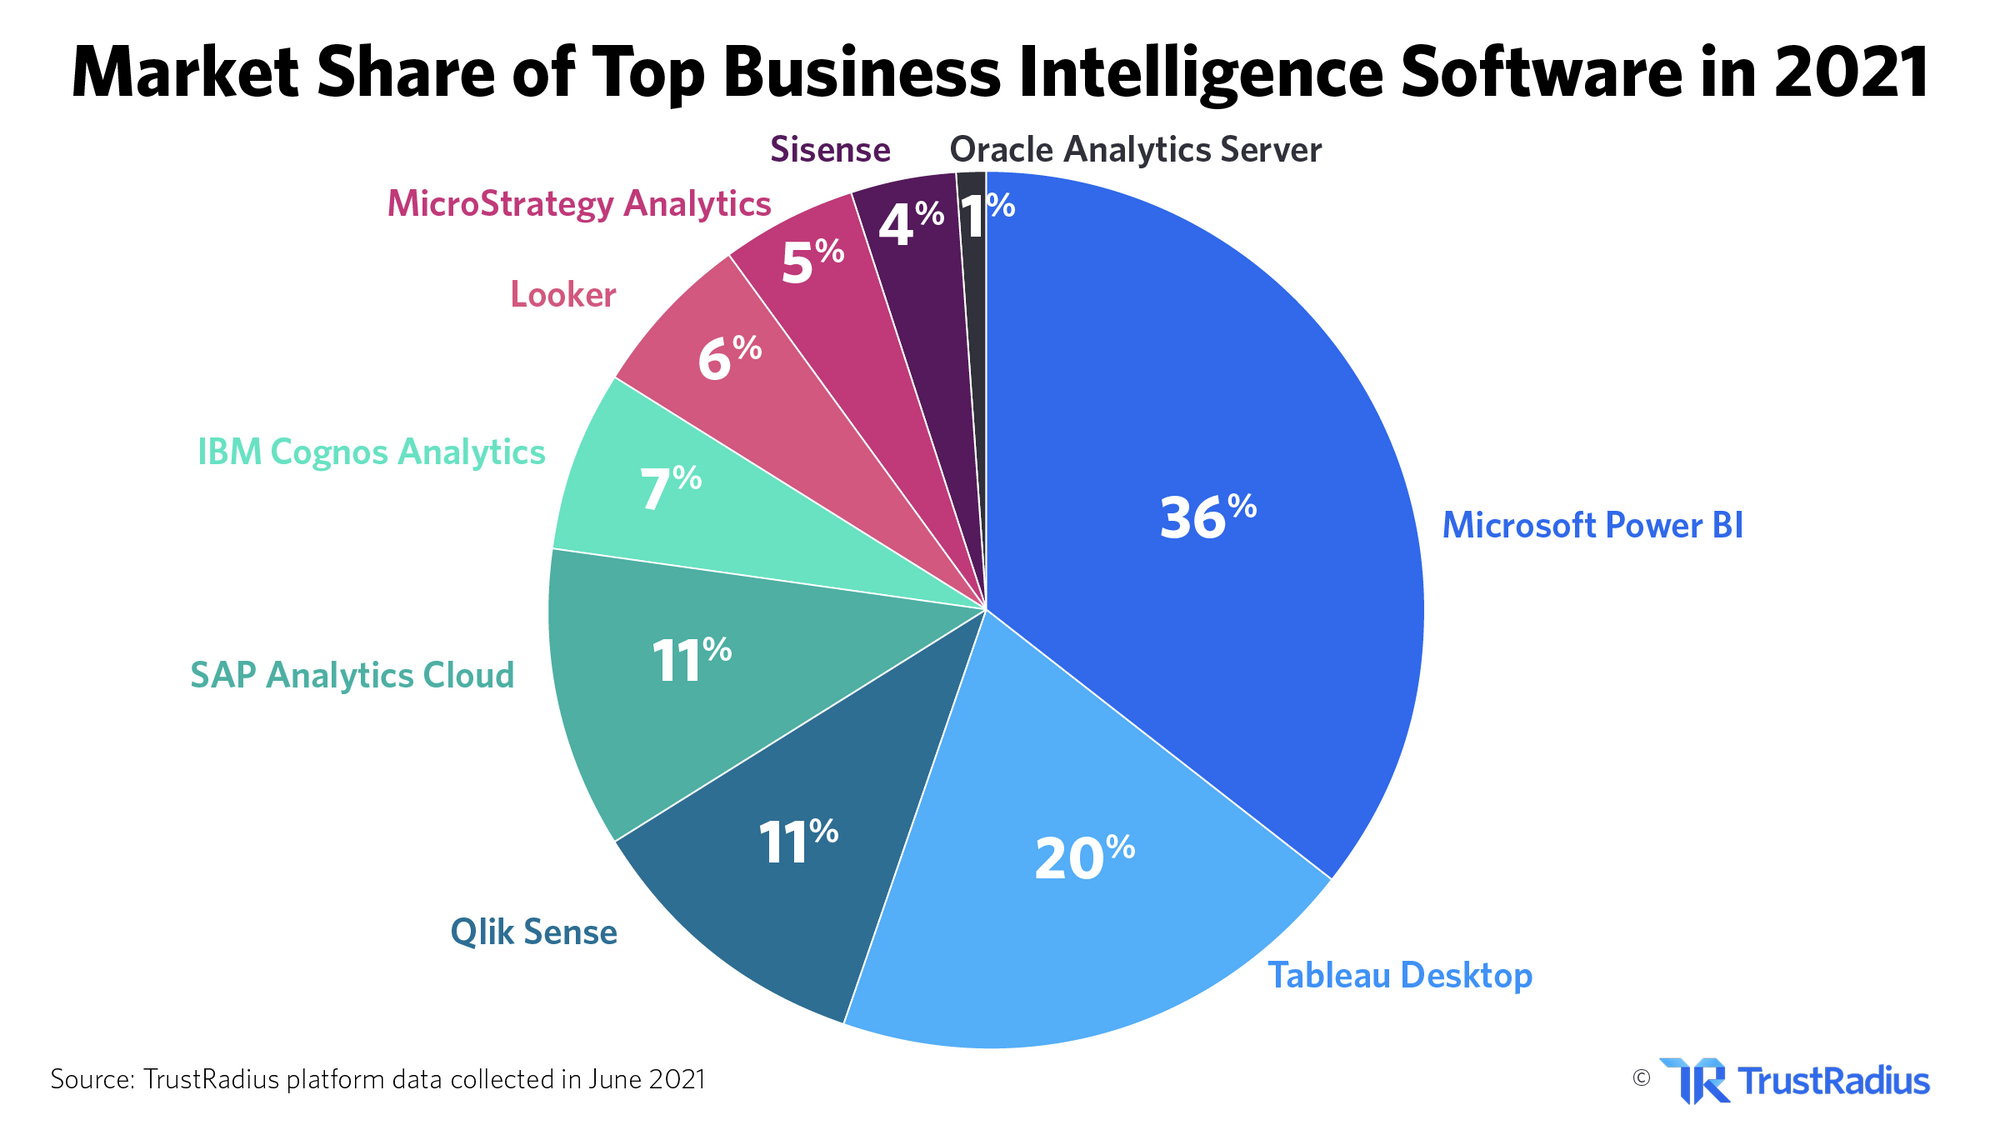
Qlik, SAP, and IBM are popular companies that have been around for a long time. I don't think they'll go away anytime soon since many large enterprises use them as their BI provider of choice.
Looker is a company that Google acquired. It has 6% of the market share. As you can see in this chart, Looker is doing well in the "Challenger" segment. It will be interesting to see how it grows and who starts using Looker.
Cost being a bottleneck for Tableau as Power BI becoming a leader
If your company uses Microsoft products, using Power BI for enterprise BI would be the easiest option. However, one of the factors that explains why customers are moving away from Tableau is the license costs.
Tableau introduced a new, lower-priced viewer license to compete against Microsoft, but it is still not clear if that is helping Tableau.
Looking at this from an individual analyst, these are the two pages I'd immediately look at and compare. Let's keep it simple and look at it from an individual analyst standpoint. (It gets a lot more complicated when looking at enterprise's needs and requirements)
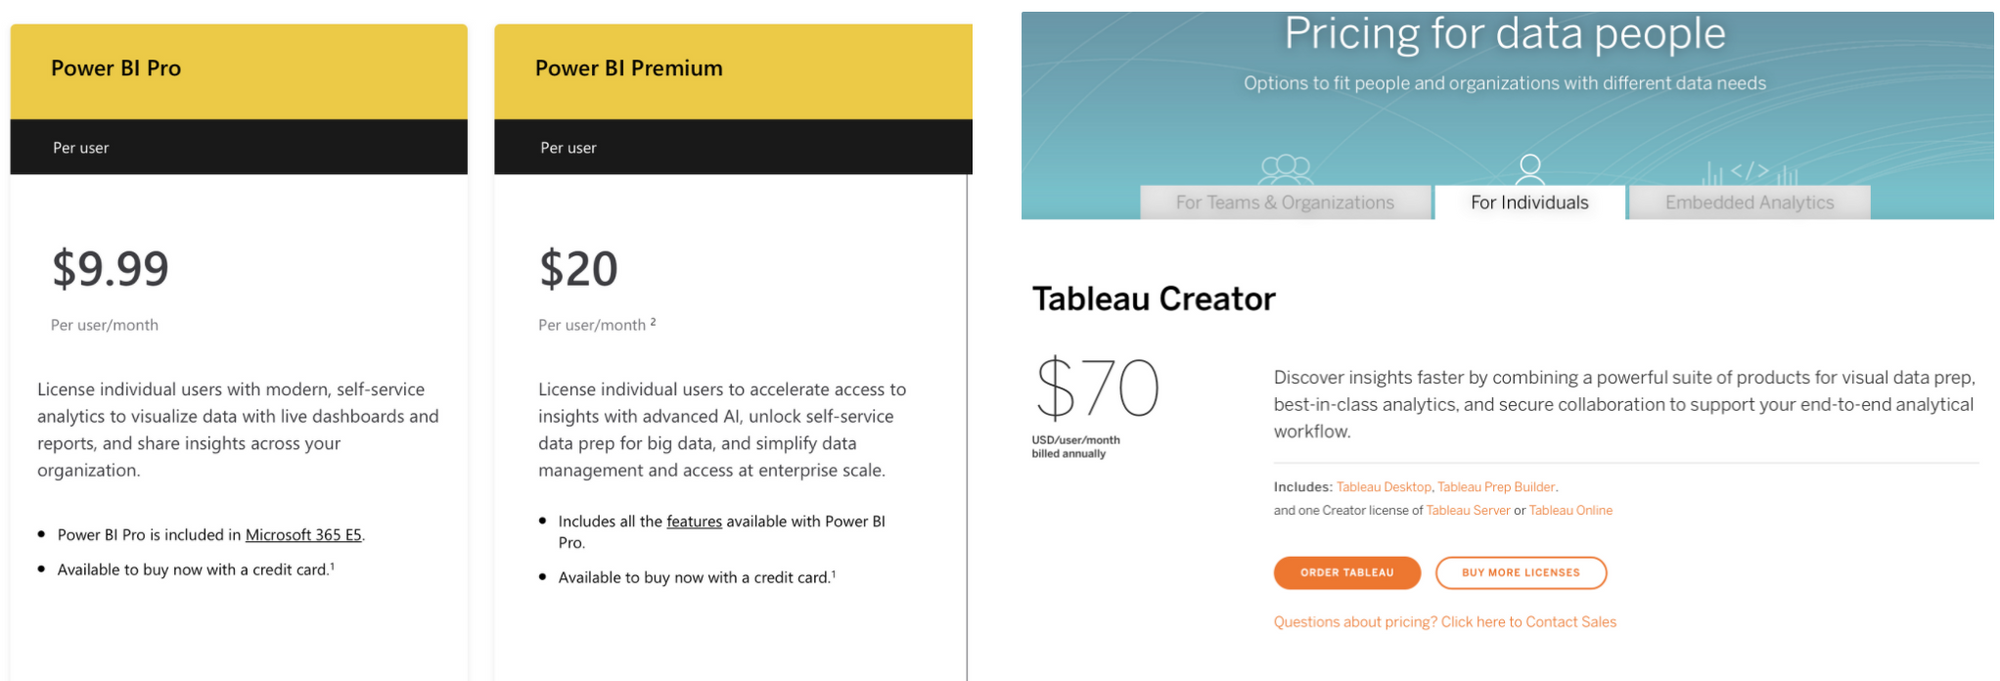
Tableau creator license comes with Tableau Desktop, Tableau Prep, and one Tableau Server or Online license. If you have multiple stakeholders who need access to view the dashboards you publish, you'll need to acquire a Tableau Viewer license. It's pretty simple to understand if you've used Tableau before, but it'll cost you $70/user/month. It is not cheap.
Power BI Free or the desktop version for individual usage is free. Though some may buy BI pro will work better.
Power BI Pro: It is the full version of Power BI. It includes Power BI features to create dashboards, reports, and views to share and consume reports created by others. This is not possible with Power BI Desktop.
Power BI Premium: In 2021, Microsoft created a new license type called "Power BI Premium." This new license lowers the initial cost and offers more flexibility. For example, with Power BI Premium, you can publish reports broadly across your enterprise without purchasing a license for every user.
Power BI Desktop is free, making entry very low for many data analysts. This is probably one of the biggest factors that helped grow Power BI's market share.
Bundled with Office 365
If bundling worked for Microsoft Power BI, it'd be interesting to see how Google's future bundling strategy with Looker will do the market share. It has a 6% market share, and Looker is relatively new compared to the other BI tools.
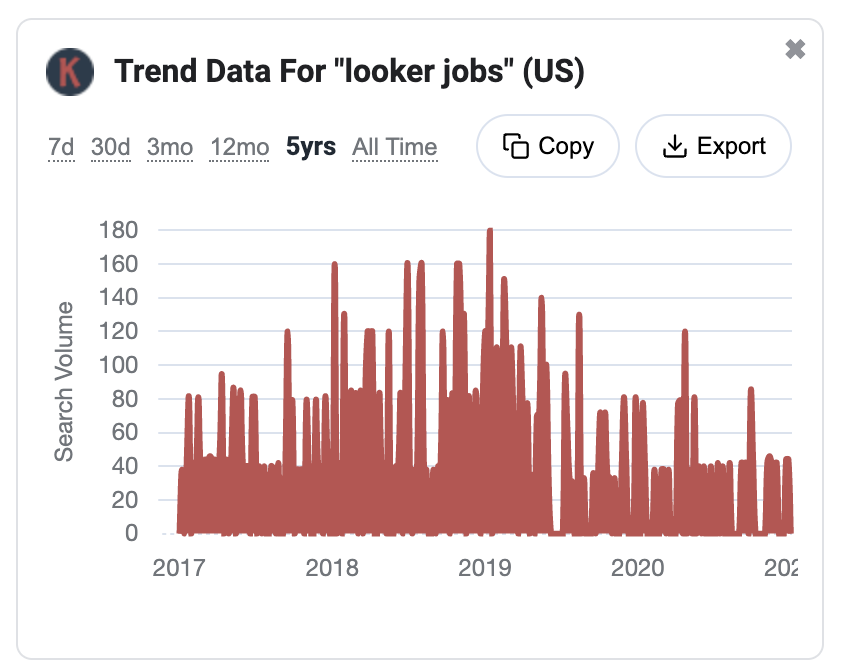
However, for now, if I look at the search volume on Looker jobs, it seems like the monthly search volume seems pretty soft relative to Power BI and Tableau.
In Summary
We all know Tableau is a great tool for visualizing and analyzing data, but have you ever tried Power BI? Then, it might be time to give it another shot!
Like any coding language, there will be a time when a favored technology tool could change. People could argue that Power BI's current domination in the market share might be a result of its novelty. But if we look at the data for Power BI jobs demand, it is clear that this tool is not going away any time soon.
As shown below, the search volume data indicates growing demand for "Power BI jobs" while "Tableau jobs" are declining.
But don't fret. As an analyst, continue to focus on answering business questions. However, start learning new tools if you're able to afford them. It never hurts to learn new things.
Join the Collective & Get Hired
This Collective will personally match talented marketers with data acumen to high-growth, high-upside opportunities at some of the most exciting companies.
Join & Get HiredIf you find this article helpful, you may also like this article –
Articles you might find interesting


 Kris
Kris

ZoomMetrix Newsletter
Join the newsletter to receive the latest updates in your inbox.