
Tableau Market Share - Business Intelligence Tools
Overview of Tableau Solutions
Tableau is a powerful data visualization tool that enables organizations to quickly and easily explore their data. It’s an intuitive solution that gives users deep insights into their data in seconds.
It was founded in 2003 and has become one of the leading BI solutions in the market.
Tableau was purchased by Salesforce in 2019 and is now part of the Salesforce Analytics Cloud.
Tableau empowers users by providing them with interactive dashboards, visualizations, and reports tailored specifically to their needs. Tableau offers a suite of products, including Desktop, Server, Online, and Public editions.
The Desktop edition is designed for individual users and small teams, while Server and Online are intended for larger organizations.
Tableau's Market Share in Business Intelligence
With a 20% market share, Tableau has the second largest market share after Power BI, wich has 1.8x higher than Tableau.
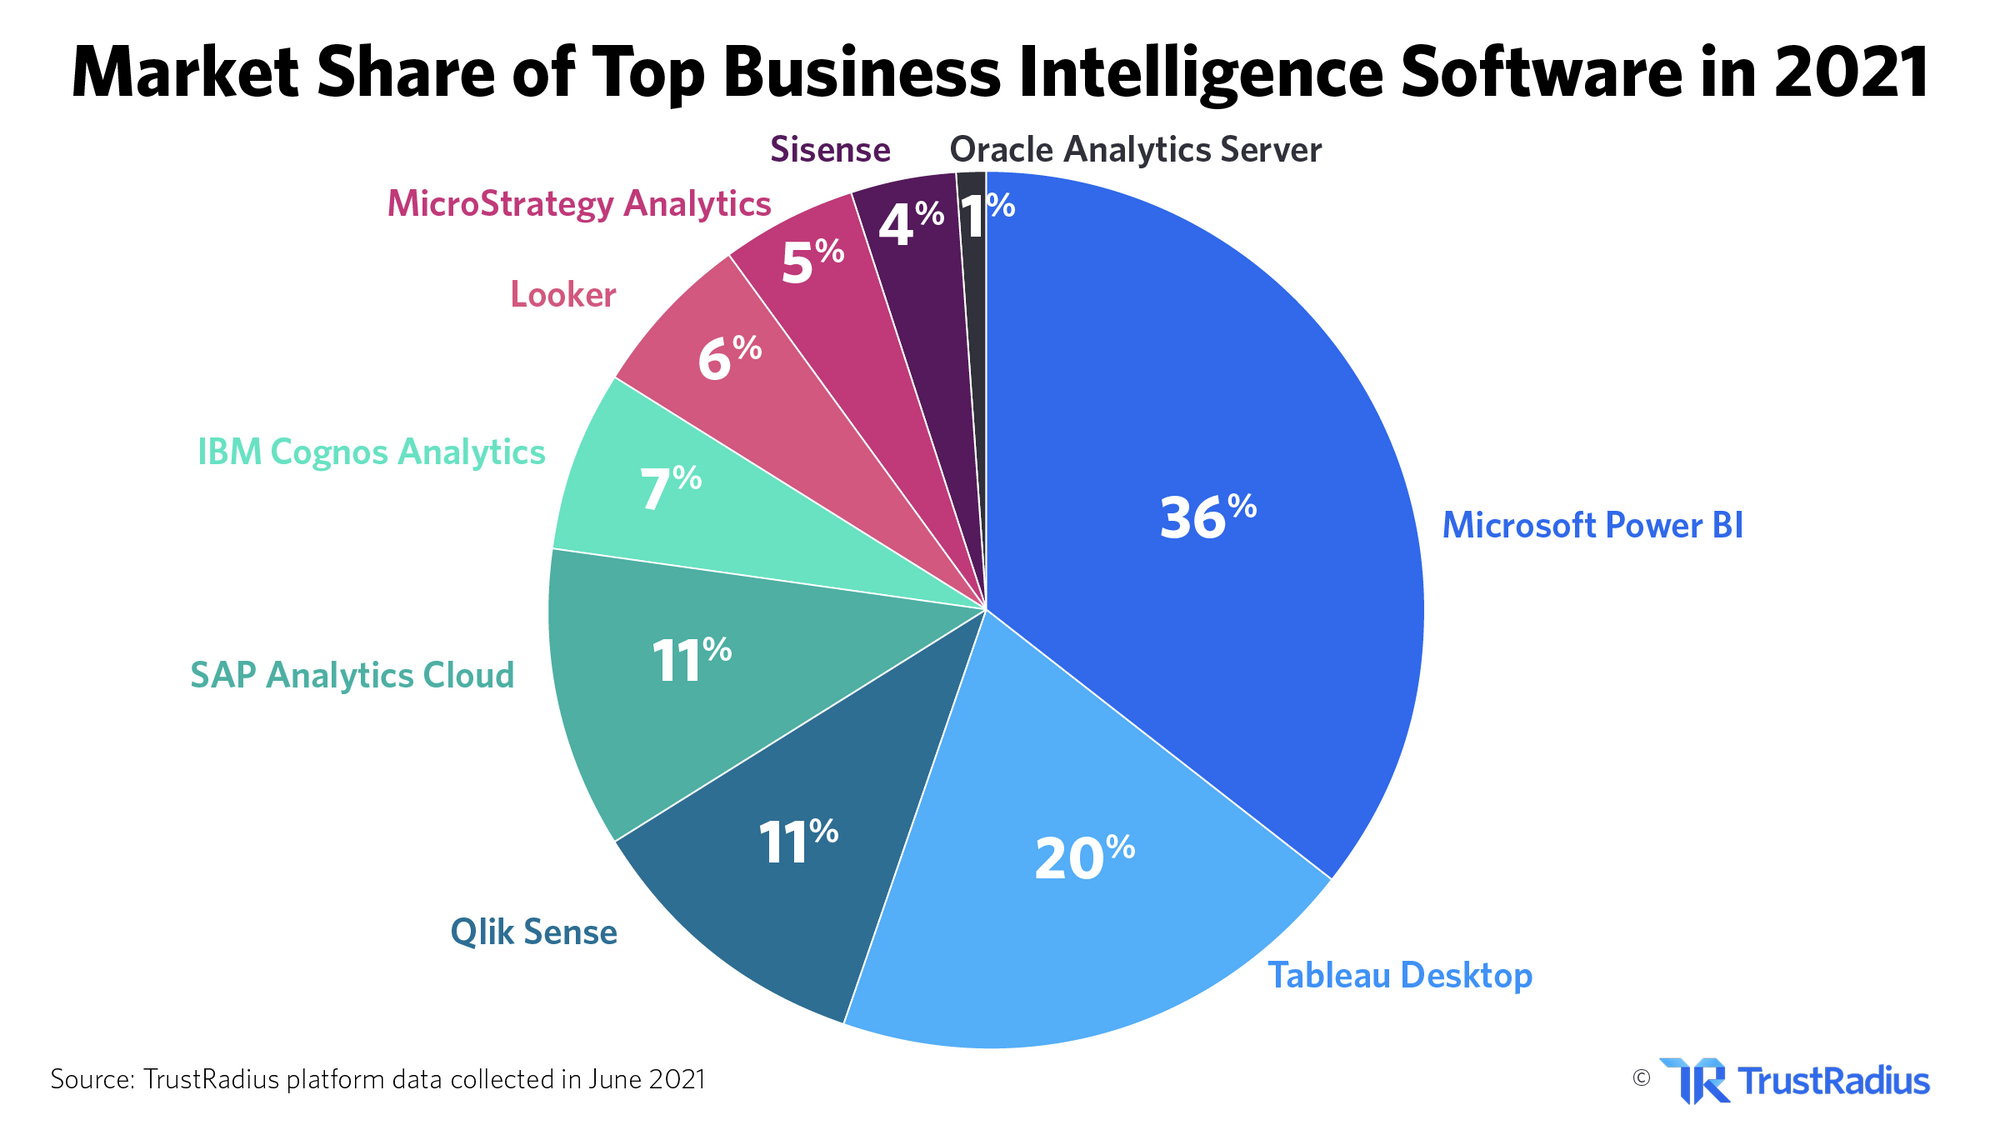
Qlik, SAP, and IBM are popular companies that have been around for a long time. I don't think they'll go away anytime soon since many large enterprises use them as their BI provider.
Looker is a company that Google acquired. It has 6% of the market share. As you can see in this chart, Looker is doing well in the "Challenger" segment. It will be interesting to see how it grows and who starts using Looker.
The Gartner's Magic Quadrant data in Feb 2021 showed Tableau in a leadership position, similar to Microsoft (Power BI).
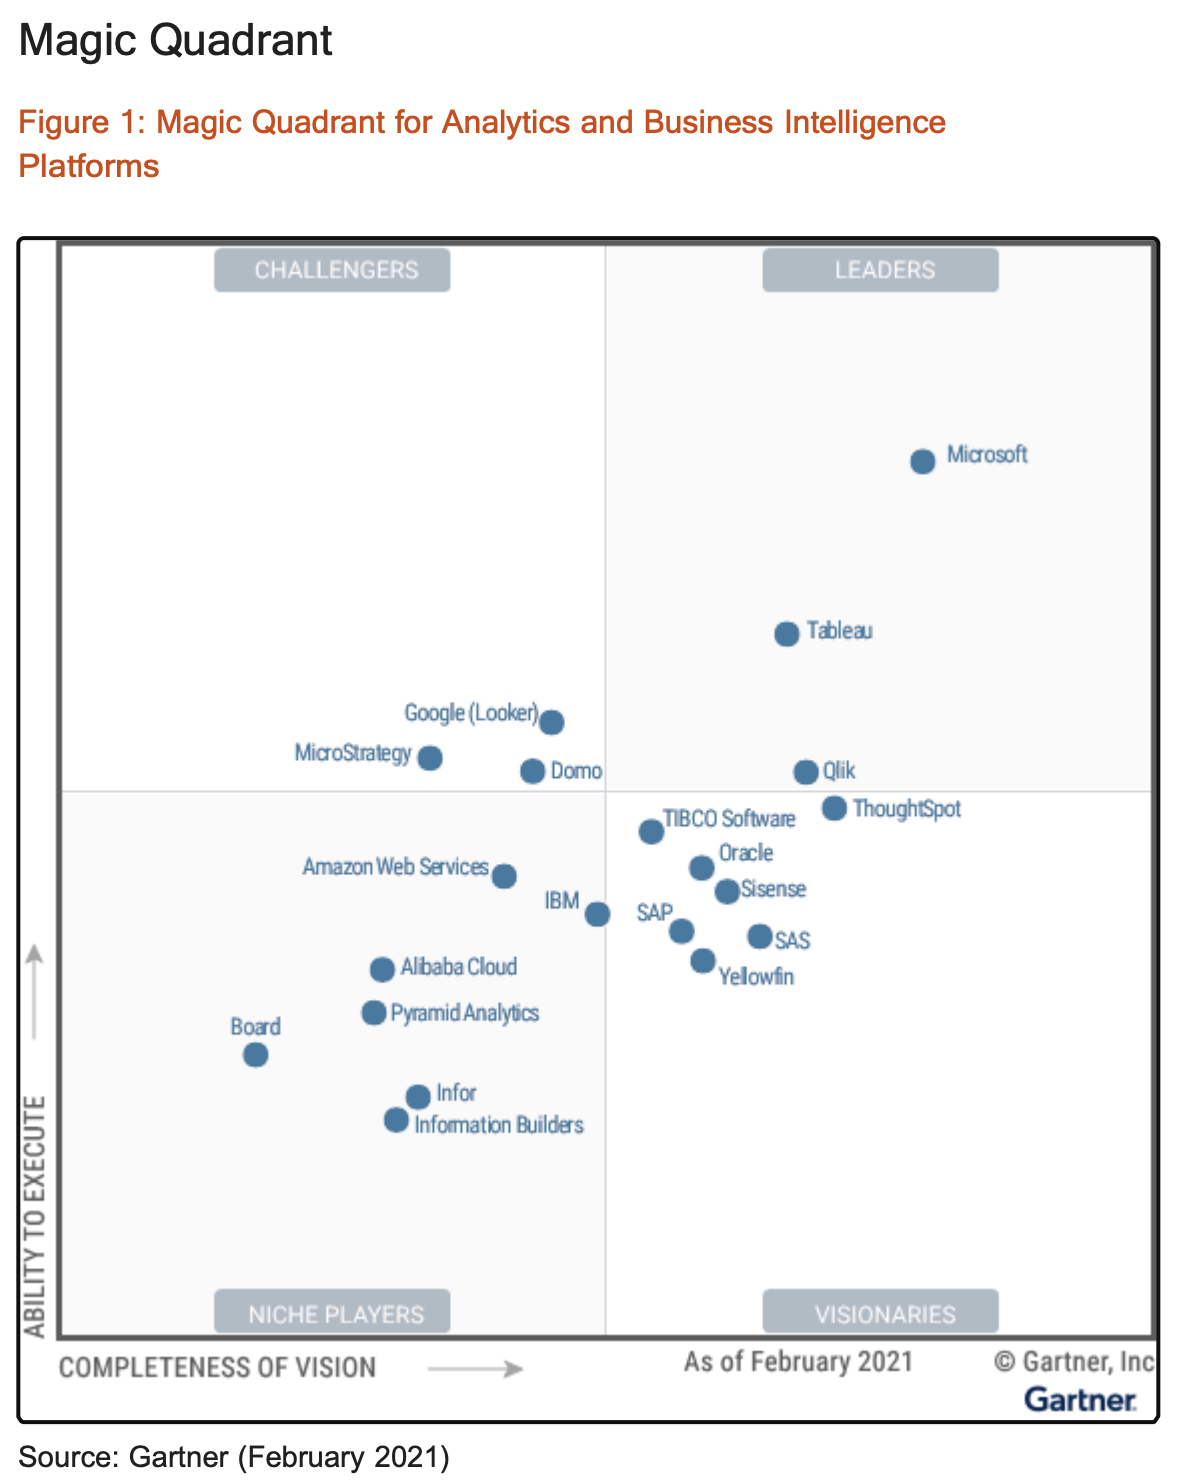
This indicates Tableau has maintained its position, but Microsoft Power BI has been achieving fast growth, increasing functionality and customer base.
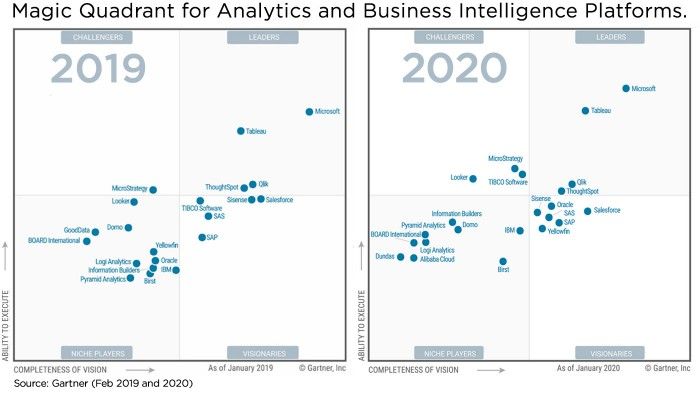
Comparing the Magic Quadrant to 2019 and 2020, it seems Power BI has been inching up on the "ability to execute" while Tableau has declined.
Who uses Tableau?
Tableau is used by businesses of all sizes, from small startups to global enterprises and in various industries.
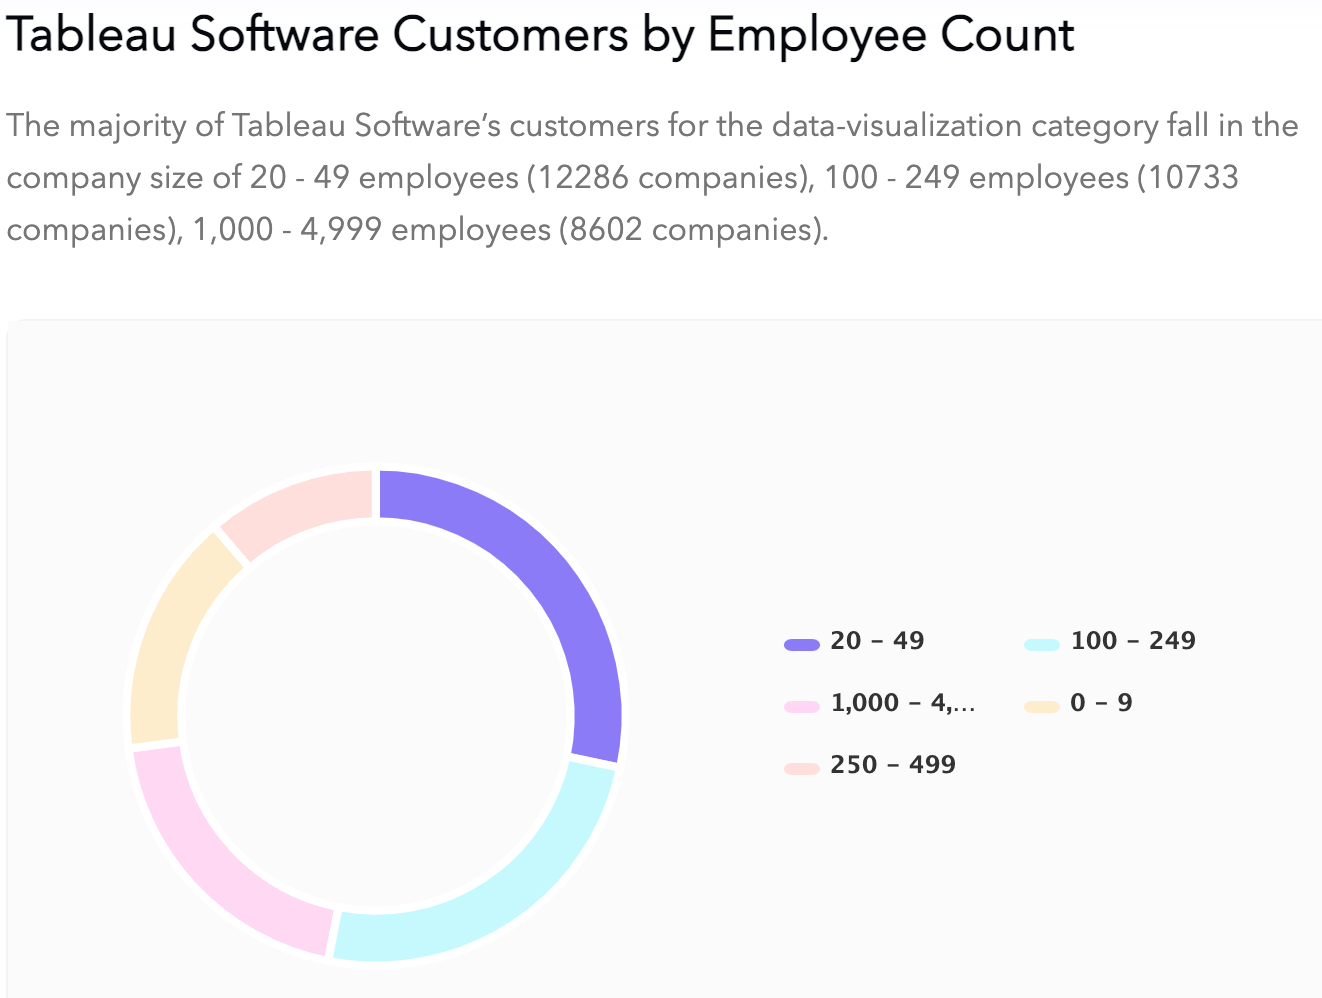
The majority of Tableau Software’s customers for the data-visualization category fall in the company size of 20 - 49 employees (12286 companies), 100 - 249 employees (10733 companies), and 1,000 - 4,999 employees (8602 companies).
The top three geographies of Tableau Software for data visualization are the United States with 51%, India with 7%, United Kingdom with 6% customers, respectively.
Tableau is popular for Business Intelligence experts and data analysts who need to visualize data quickly. It is also popular for those working with Big Data, as Tableau allows users to explore large amounts of data and gain insights from it.
Why is Tableau popular?
Tableau’s popularity comes from its ease of use, the ability to create interactive visualizations, and the ability to scale up or down depending on the size of an organization. It also has a strong community and support system so users can get help with any issues.
Tableau provides users with a wide range of features, such as drag-and-drop visualizations, custom data connections, and intuitive dashboard design. This makes it easy for users to explore their data without having to be an expert in software development or coding.
A diverse list of data sources you can connect to Tableau contributes to its popularity. It supports many data sources, such as Hadoop clusters, Salesforce and Google BigQuery.
Tableau also allows users to deploy their visualizations in multiple ways, such as embedded into webpages, shared via URL, or published directly on Tableau Server. This makes it easy for users to share their insights with others.
Finally, Tableau strongly emphasizes data security and governance, which is essential for many organizations. It offers multiple levels of authentication, auditing, and access control. This helps ensure that only authorized users can view sensitive data.
All these features have made Tableau a popular choice for data visualization and Business Intelligence. So it’s no wonder it has taken a significant market share over the years.
Why PowerBI is gaining popularity over Tableau
You can see from the Google Trends data and PowerBI market share that PowerBI is becoming increasingly popular. This is likely due to its user-friendly interface, powerful features, and the fact that analysts can use it in conjunction with Microsoft Office 365.
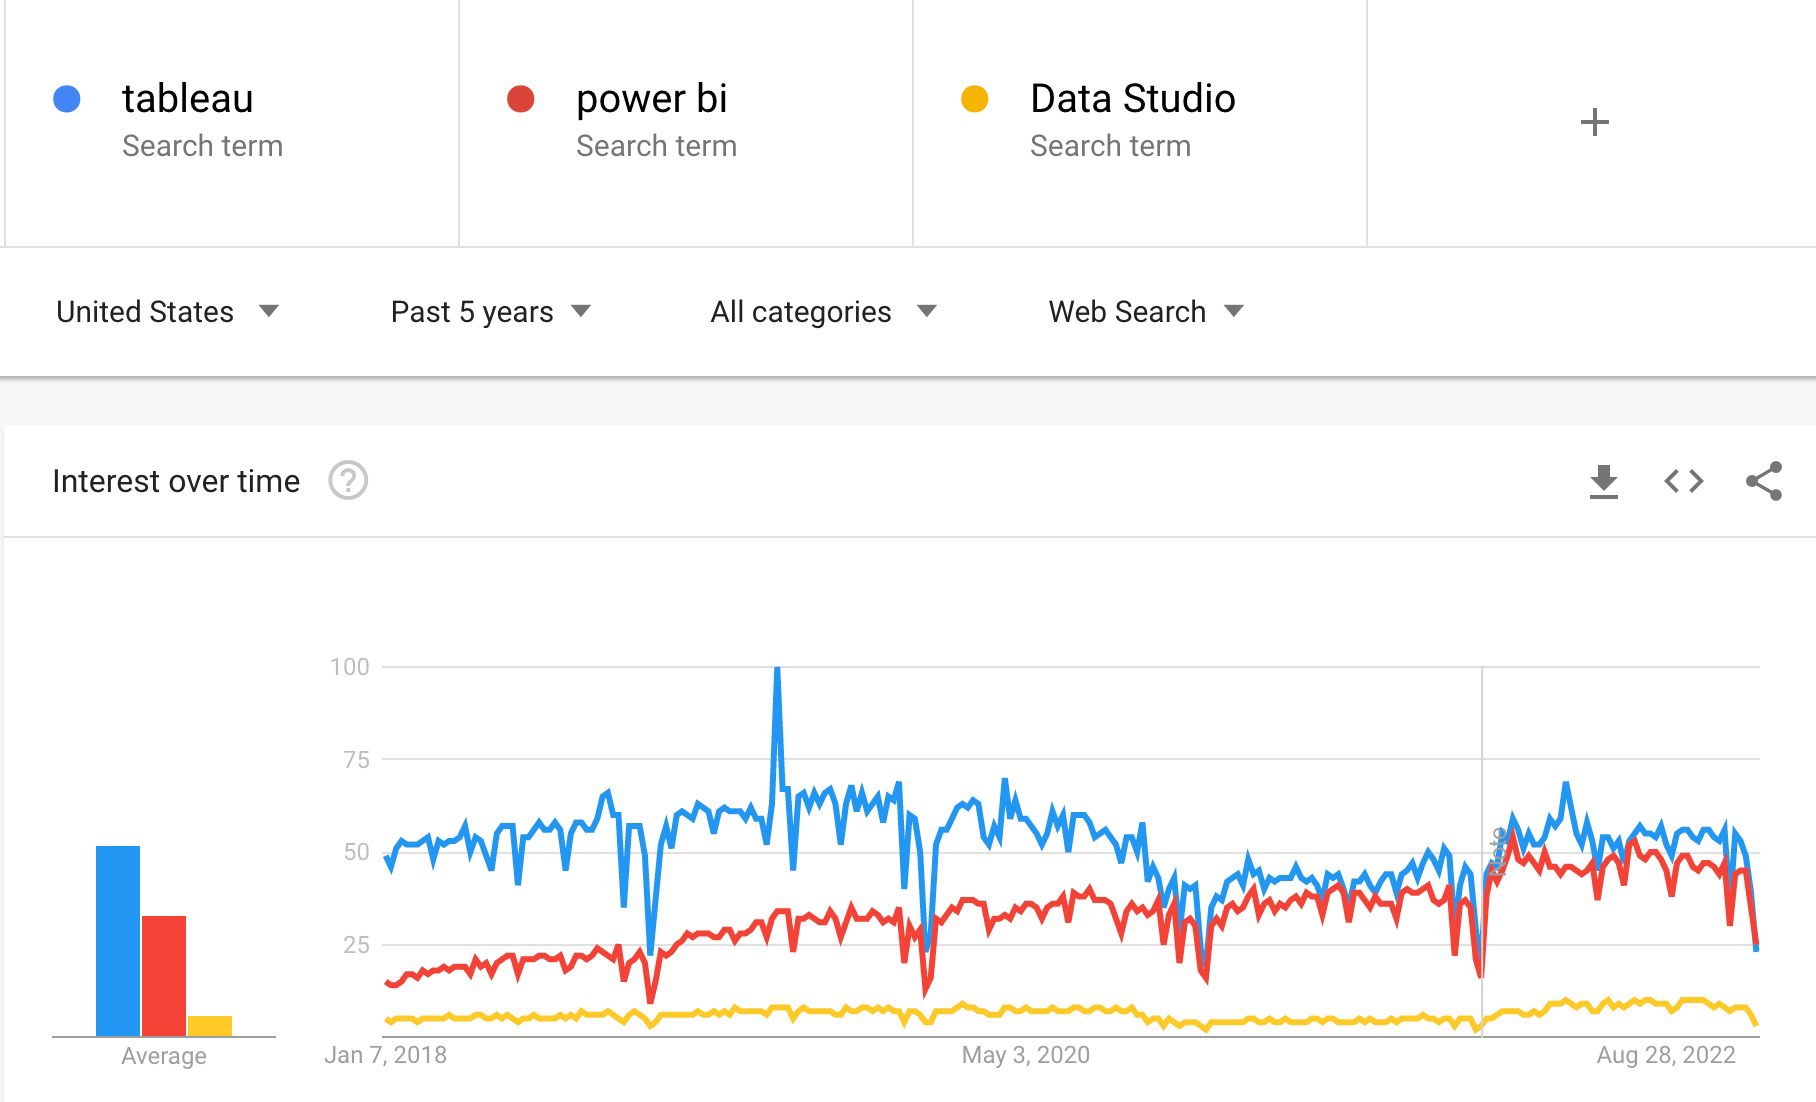
PowerBI's popularity is eating into Tableau's market share. Indeed, PowerBI is still behind Tableau in terms of overall usage, but the gap between them is quickly closing.
This could spell trouble for Tableau if they don't keep up with the latest developments and trends in the BI space.
Join the Collective & Get Hired
This Collective will personally match talented marketers with data acumen to high-growth, high-upside opportunities at some of the most exciting companies.
Join & Get HiredArticles you might find interesting


ZoomMetrix Newsletter
Join the newsletter to receive the latest updates in your inbox.