What is Power BI Used for and How Businesses Are Leveraging It
Discover how businesses leverage Power BI’s visuals & data insights for decision-making, customer management, financial tracking, and more. Learn why it stands out.
Picture this: a marketer drowning in data from Excel sheets, cloud platforms, and random databases. The mission? Make sense of the chaos and turn it into something useful. That’s where Power BI comes in—a game-changer for businesses and marketers in today’s data-driven world.
Built by Microsoft, Power BI takes raw data and transforms it into interactive dashboards, reports, and visualizations that actually make sense. It pulls data from everywhere—cloud services, spreadsheets, even live streams—and puts it all in one place. The best part? You don’t need to be a data expert to use it.
With its simple, user-friendly interface, Power BI lets businesses track performance, spot trends, and make smarter decisions in real time. For so many companies, it’s the tool that turns data overload into clear, actionable insights—and smarter decisions that get results.
Businesses today are swimming in a sea of complex data. From financial reports to social media metrics, operational statistics to customer feedback, the sheer volume and variety of data can feel overwhelming. But buried within this raw data are insights that, when unlocked, can drive smarter decisions and competitive advantages.
Meet Microsoft Power BI—a powerful tool that transforms piles of data into clear, actionable insights. In this article, we’ll dive into what Power BI is, its main features, and, most importantly, how businesses are using it to tackle challenges, improve operations, and build a data-driven mindset.
What Is Microsoft Power BI?
At its core, Power BI is a suite of tools and services that allows organizations to connect to various datasets, visualize complex information through interactive dashboards, and share insights with teams.
Think of Power BI as the bridge between your data and your decision-making. It transforms fragmented datasets into coherent, visually engaging reports and dashboards, making it easier for users to draw insights and act.
Key Benefits of Power BI
- Seamless Data Connectivity
Power BI offers extensive connectivity, integrating with data sources ranging from Excel spreadsheets on your desktop to large-scale cloud services like Azure, Salesforce, and Google Analytics.
- Interactive Data Visualization
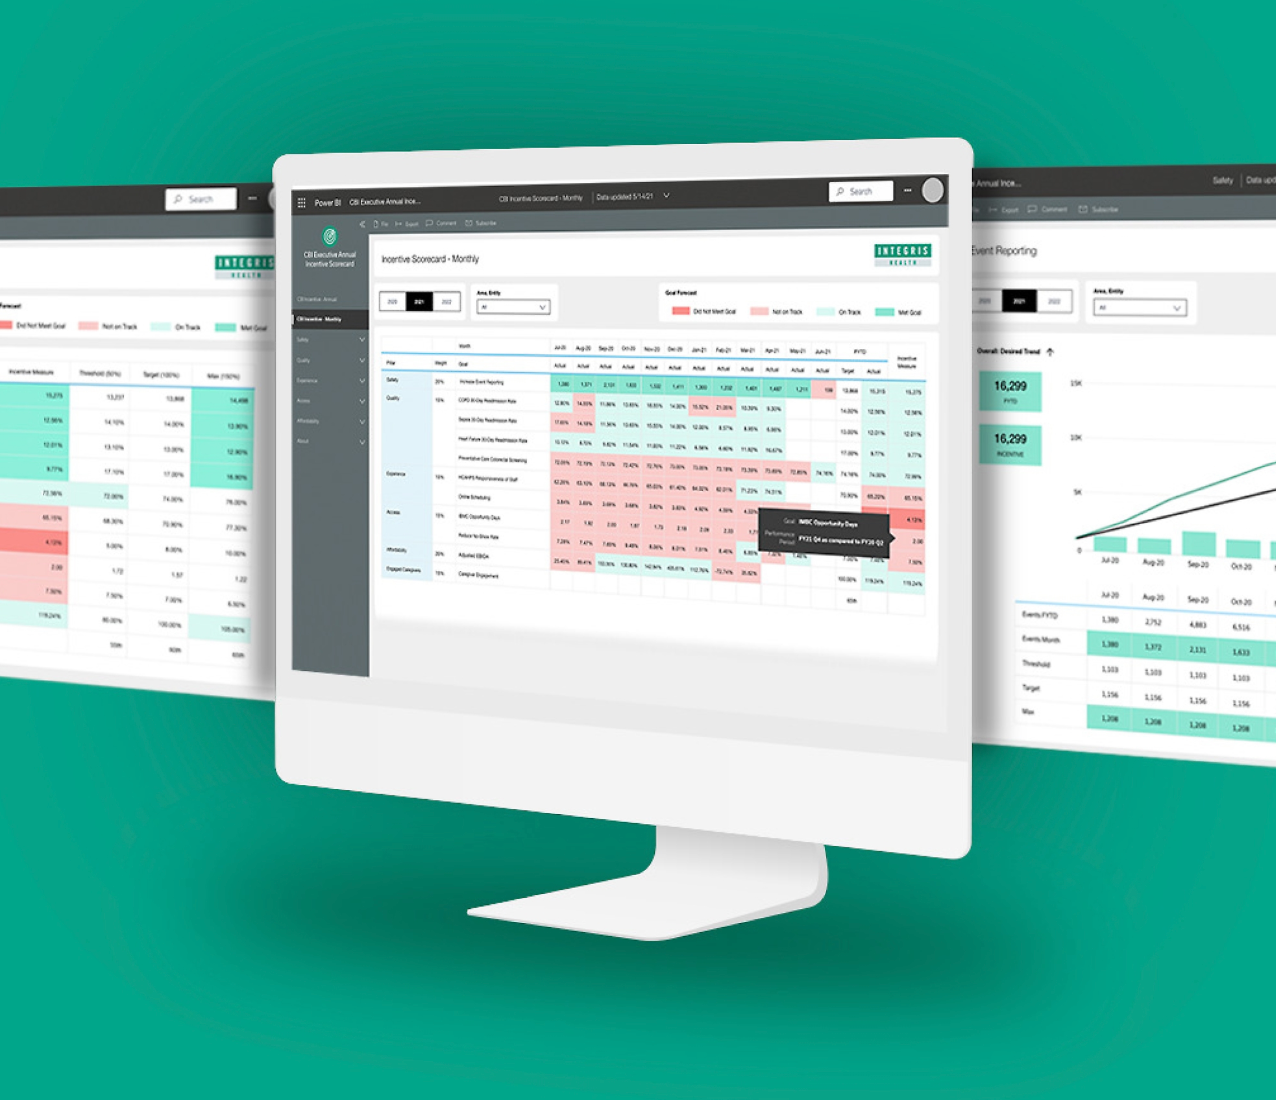
Users can create dynamic, visually impactful dashboards and reports that bring data to life. This allows users to identify patterns, trends, and outliers more effectively.
- Collaboration and Sharing
Power BI enables teams to share datasets, reports, and dashboards both online and offline, ensuring everyone is aligned with the latest insights.
- Integration with Microsoft Tools
Designed to work seamlessly with other Microsoft products, such as Excel, Teams, and Office 365, Power BI enhances collaboration, making it user-friendly and efficient for Microsoft ecosystem users.
Power BI’s commitment to making data actionable has helped countless businesses achieve one powerful goal—empowering decision-makers with real-time insights.
Key Components of Power BI
To understand how businesses can use Power BI efficiently, it’s helpful to know its main components.
1. Power BI Desktop
- What It Is: A Windows-based desktop application where data professionals can create reports.
- Key Functions:
- Import and transform datasets.
- Build visual dashboards.
- Design predictive models.
- Benefit: Familiar Excel-like interface that simplifies report building, ensuring a steeper learning curve for new users.
2. Power BI Service
- What It Is: A cloud-based platform (Software-as-a-Service) for sharing and collaborating on Power BI dashboards.
- Key Functions:
- Publish visuals from Power BI Desktop for easy online access.
- Collaborate in real time by sharing insights with stakeholders.
- Benefit: Teams can interact with reports and dashboards from anywhere, keeping everyone in sync.
3. Power BI Mobile Apps
- What It Is: Mobile applications for iOS, Android, and Windows platforms.
- Key Functions:
- Access dashboards on the go.
- Receive real-time notifications for critical changes.
- Benefit: Business leaders get instant updates, ensuring decisions can happen anywhere, anytime.
4. Power BI Report Builder
- What It Is: A tool specifically designed for paginated reports (formatted for print).
- Key Functions:
- Create detailed operational reports.
- Optimize reports for consistent print distribution.
- Benefit: Perfect for needs like invoices, financial reports, and legal documents.
5. Power BI Report Server
- What It Is: An on-premise solution for businesses needing to host Power BI behind a secure firewall.
- Key Functions:
- Create and share Power BI and paginated reports in highly secure environments.
- Benefit: Offers all the benefits of Power BI with added data control and security.
How Businesses Use Power BI
Power BI’s flexibility allows businesses across departments and industries to unlock unique insights. Here are some of the most effective use cases.
1. Data Analysis and Visualization
Power BI helps businesses make sense of enormous datasets by converting them into actionable visuals.
- Example: Retailers use Power BI dashboards to assess sales performance, spot inventory issues, and track regional trends.
2. Real-Time Dashboards for Decision-Making
Interactive dashboards are a highlight of Power BI, offering real-time monitoring of KPIs.
- Example: Marketing teams use real-time dashboards to monitor campaign performance across channels like social media, email, and PPC.
3. Customer Relationship Management (CRM)
By integrating Power BI with CRM tools (e.g., Salesforce), companies can gather deeper insights about customer behaviors and improve retention efforts.
- Use Case: Meijer leveraged Power BI solutions to analyze customer interactions and align stocking decisions with buying trends.
4. Financial Reporting
Finance professionals rely on Power BI for up-to-date revenue tracking and expense management.
- Benefit: Beyond streamlining routine checks, it also provides forecasts that businesses can trust. This visibility improves profitability by identifying where costs might spiral.
5. Manufacturing and Supply Chain Management
For businesses with extensive supply chains, Power BI simplifies inventory tracking, shipment analysis, and supplier performance monitoring.
- Example: Walmart uses Power BI to centralize its inventory systems and improve supply chain logistics.
6. HR Analytics for Better Workplace Insights
Human resources departments use Power BI for tracking employee turnover, hiring metrics, and diversity goals.
- Example: IBM integrates Power BI for tracking its recruitment network and aligning efforts with diversity objectives.
7. Sales and Revenue Forecasting
Sales teams leverage Power BI for predictive sales forecasting based on historical and real-time data.
- Use Case: By analyzing data trends and seasonality, sales teams create more accurate revenue projections.
Expanding Reach with Embedded Content
Power BI’s “Publish to web” feature allows businesses to extend their reporting capabilities beyond internal usage.
- Example Applications include embedding Power BI dashboards in blog posts, emails, and websites to share insights with shareholders, partners, or customers.
- Benefit: Great for democratizing data while expanding the impact of your work.
Honest Feedback on Power BI
What People Love
- Visualization Power: Users consistently praise the intuitive design and robust visualization options.
- Integration: Seamless compatibility with Microsoft tools ensures a smooth user experience.
- Data-Driven Decisions: Businesses love how Power BI removes guesswork in decision-making.
Areas for Improvement
- Learning Curve for Advanced Features: Complex features like DAX functions can be initially intimidating for less technical users.
- Large Dataset Performance Issues: Heavy users occasionally report lagging dashboards when working with extremely large datasets.
Despite minor limitations, Power BI remains a top-tier BI solution preferred by both small firms and enterprise giants.
Empower Your Business with Power BI
Businesses today need more than raw data—they need actionable insights to stay competitive. Power BI offers that and more, enabling organizations to make smarter, faster, and more confident decisions every day.
If your organization isn’t yet leveraging Power BI, it might just be the missing puzzle piece in your data strategy. Start small, explore Power BI’s features, and unlock the full potential of your operational data.
Related Articles


ZoomMetrix Newsletter
Join the newsletter to receive the latest updates in your inbox.